
In this beginner-friendly guide, you’ll learn how to Analyze Volume in the Stock Market Like a Pro , and how professional traders use it every day.
Welcome to JD Trading Zone
Many beginner traders spend all their time studying candlestick patterns, support and resistance, and indicators. However, they often ignore one of the most powerful tools in technical analysis—volume.
Professional traders don’t just watch price movements. They also observe how much trading activity is happening behind those price moves. Volume helps answer one important question:
“Is this price movement supported by real buying or selling interest?”
Learning to read volume correctly can help you identify strong trends, avoid fake breakouts, and make more confident trading decisions.
Also check:- (Top 10 Free Trading Tools Every Trader Should Use) (Swing Trading vs Intraday Trading: Which Is Better for Beginners?) (How to Create a Trading Plan That Actually Works) (Trading Psychology: How to Control Fear, Greed, and FOMO) (What Is Risk-Reward Ratio? Why Every Trader Should Use It)
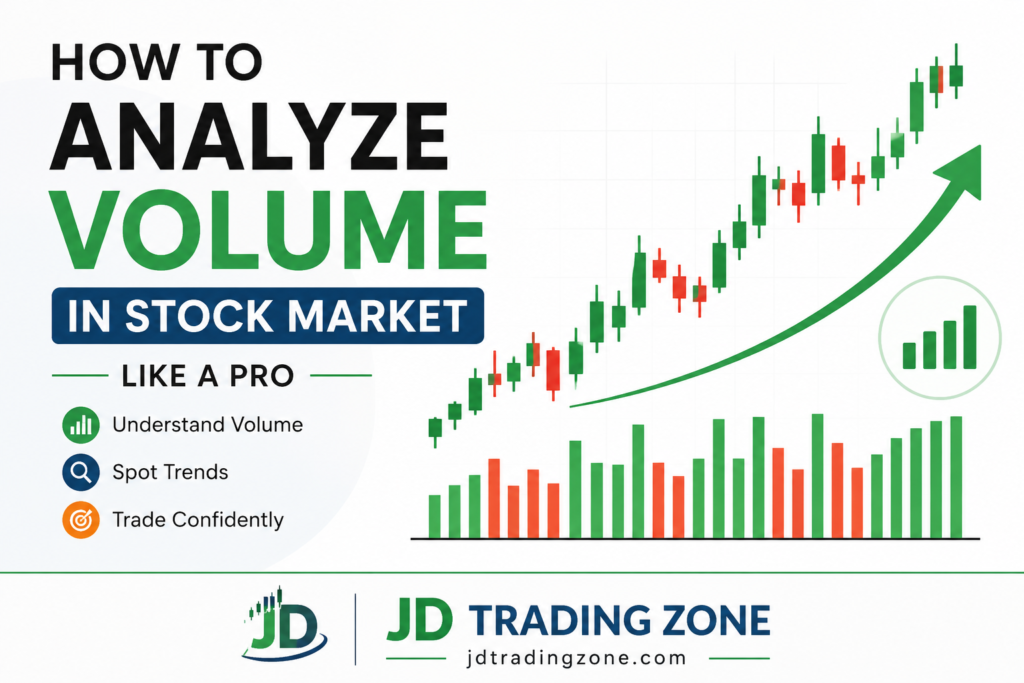
How to use Volume in the Stock Market
What Is Volume in the Stock Market?
Volume is simply the total number of shares traded during a specific period.
For example:
• 5-minute chart → Volume shows shares traded in 5 minutes.
• 1-hour chart → Volume shows shares traded in one hour.
• Daily chart → Volume shows shares traded during the entire trading day.
Every candlestick has a corresponding volume bar below it.
High volume = More participation
Low volume = Less participation
Think of volume as the fuel that powers price movement.
Why Is Volume So Important?
Price tells you what happened.
Volume tells you how strong that movement actually is.
Without volume confirmation, price movements can often be misleading.
For example:
• Price rises with strong volume → Buyers are serious.
• Price rises with weak volume → Move may not last.
• Price falls with heavy volume → Strong selling pressure.
• Price falls with low volume → Temporary weakness.
Professional traders rarely trust price alone.
Below every price chart, you’ll see vertical bars.
Each bar represents trading activity during that candle.
Generally:
• Taller bars = Higher trading activity
• Short bars = Lower trading activity
Many trading platforms color them:
• Green = Buying volume dominates
• Red = Selling volume dominates
Remember:
The color itself is less important than the overall size of the volume bar.
Golden Rule of Volume Analysis
One of the most important rules in trading is:
Price + Volume = Confirmation
Never analyze price without checking volume.
1. Rising Price with Rising Volume
This is one of the strongest bullish signals.
It means:
• Buyers are entering aggressively.
• Institutions may be accumulating shares.
• Trend has healthy participation.
Example:
Stock moves from ₹500 to ₹520 while volume doubles.
This indicates genuine buying interest.
Professional traders usually prefer trades that have this confirmation.
2. Rising Price with Falling Volume
This is a warning sign.
Price is moving higher, but fewer traders are participating.
Possible reasons:
• Weak momentum
• Short covering
• Lack of fresh buyers
Such rallies often slow down or reverse.
3. Falling Price with High Volume
This usually indicates strong selling pressure.
Possible reasons:
• Panic selling
• Institutional selling
• Negative news
Large volume during declines often signals that sellers are in control.
4. Falling Price with Low Volume
Not every price decline is bearish.
Sometimes the market falls simply because buyers temporarily step aside.
Low-volume pullbacks often occur in healthy uptrends.
Many swing traders look for buying opportunities after these pullbacks.
Volume During Breakouts
One of the best uses of volume is confirming breakouts.
→ Strong Breakout
If price breaks above resistance with high volume, the breakout is more reliable.
This shows that many traders support the move.
Example:
Resistance at ₹1000.
Price closes at ₹1025 with the highest volume in several weeks.
This is generally considered a strong breakout.
→ Weak Breakout
If price crosses resistance but volume remains low, the breakout may fail.
These are often called false breakouts.
Always wait for volume confirmation before entering breakout trades.
Volume During Support Breakdown
The same rule applies to bearish moves.
If support breaks with heavy volume:
• Sellers are aggressive.
• Downtrend becomes stronger.
If support breaks on low volume:
• Breakdown may fail.
• Price can quickly recover.
Volume in Trending Markets
→ Healthy Uptrend
• Higher highs
• Higher lows
• Increasing volume during rallies
• Lower volume during pullbacks
→ Healthy Downtrend
• Lower highs
• Lower lows
• Heavy selling volume
• Weak buying volume
These characteristics help professionals judge trend quality.
Volume Spikes: What Do They Mean?
A sudden large increase in volume is called a volume spike.
Possible reasons:
• Quarterly earnings
• Company announcements
• News events
• Institutional buying
• Institutional selling
A volume spike tells you:
Something important is happening.
However, don’t trade based only on the spike.
Always combine it with price action.
How Institutions Use Volume
Large institutions cannot buy millions of shares instantly.
Instead, they accumulate positions gradually.
During accumulation:
• Price may move slowly.
• Volume starts increasing.
• Selling pressure becomes weaker.
Professional traders often look for these signs before large trends begin.
Best Volume Patterns Every Beginner Should Know
→ High Volume Breakout
One of the most reliable setups.
• Price breaks resistance.
• Volume significantly above average.
• Momentum increases.
→ Volume Dry-Up
Volume becomes unusually low.
This often happens before:
• Strong breakouts
• Trend continuation
• Major market moves
Low activity usually doesn’t last forever.
→ Climax Volume
Very high volume after a long trend.
Can indicate:
• Buying climax
• Selling climax
• Trend exhaustion
This does not always mean reversal, but it deserves attention.
How to Use Volume with Price Action
Instead of relying on indicators alone, combine volume with:
• Support and resistance
• Trendlines
• Candlestick patterns
• Chart patterns
• Moving averages
This creates stronger trade confirmation.
Common Mistakes Beginners Make
→ Ignoring Volume
Many traders enter trades based only on candlesticks.
Always confirm with volume.
→ Trading Every Volume Spike
Not every spike leads to a profitable move.
Always study the surrounding price action.
→ Using Volume Alone
Volume should never be your only reason to enter a trade.
Combine it with proper analysis.
→ Forgetting the Bigger Picture
Volume on a 5-minute chart may look strong but could be insignificant on the daily chart.
Always analyze multiple timeframes.
Simple Volume Analysis Checklist
Before entering a trade, ask yourself:
✅ Is volume above average?
✅ Does volume confirm the trend?
✅ Is this a genuine breakout?
✅ Is price near support or resistance?
✅ Are buyers or sellers in control?
If most answers are “Yes,” the trade may have stronger confirmation.
Best Indicators That Work with Volume
Volume becomes even more useful when combined with:
• VWAP
• Volume Moving Average
• On Balance Volume (OBV)
• Volume Profile
• Accumulation/Distribution Indicator
Remember, these tools should support your analysis—not replace it.
Practical Example
Suppose a stock trades between ₹900 and ₹930 for several days.
One day:
• Price closes at ₹940.
• Volume is three times the average.
• The candle closes near its high.
This suggests strong buying interest, making the breakout more trustworthy than one with low volume.
Final Thoughts
Volume is one of the simplest yet most powerful tools in technical analysis. It helps you understand the conviction behind every price move, making it easier to spot strong trends and avoid weak or false signals.
For beginners, the goal isn’t to predict every market move. It’s to identify high-probability opportunities by combining price action, support and resistance, and volume confirmation. With consistent practice, reading volume becomes second nature and can significantly improve your trading decisions.
Disclaimer: This article is for educational purposes only and should not be considered financial or investment advice. Always do your own research and manage risk before trading.
How to Analyze Volume in the Stock Market Like a Pro
Frequently Asked Questions (FAQs)
Is volume more important than price?
→ No. Price is primary, but volume provides confirmation and helps judge the strength of price movements.
What is considered high volume?
→ High volume is generally trading activity that is significantly above the stock’s recent average volume.
Can volume predict market direction?
→Volume cannot predict the future, but it can confirm whether a trend or breakout is likely to be stronger or weaker.
Which traders benefit most from volume analysis?
→ Intraday traders, swing traders, and positional traders all use volume to improve trade quality and confirm market moves.
Should beginners use volume in every trade?
→ Yes. Checking volume before entering a trade can help filter out weak setups and improve decision-making.
How to Analyze Volume in the Stock Market Like a Pro
If this blog makes sense to you give your feedback in comments and stay tuned for more information about JD Trading Zone.
Pingback: Best Candlestick Patterns for Intraday Trading - jdtradingzone