
If you are beginning trading then you should know Common Chart Patterns Every Trader Must Know, how they work, and how beginners can use them effectively.
Welcome to JD Trading Zone
Chart patterns are one of the most important tools in technical analysis. They help traders understand market psychology and identify potential buying or selling opportunities before major price moves happen.
Whether you are an intraday trader, swing trader, or long-term investor, learning chart patterns can improve your decision-making and confidence.
Also check:- (Top 10 Free Trading Tools Every Trader Should Use) (Swing Trading vs Intraday Trading: Which Is Better for Beginners?) (How to Create a Trading Plan That Actually Works) (Trading Psychology: How to Control Fear, Greed, and FOMO) (How to Analyze Volume in the Stock Market Like a Pro)
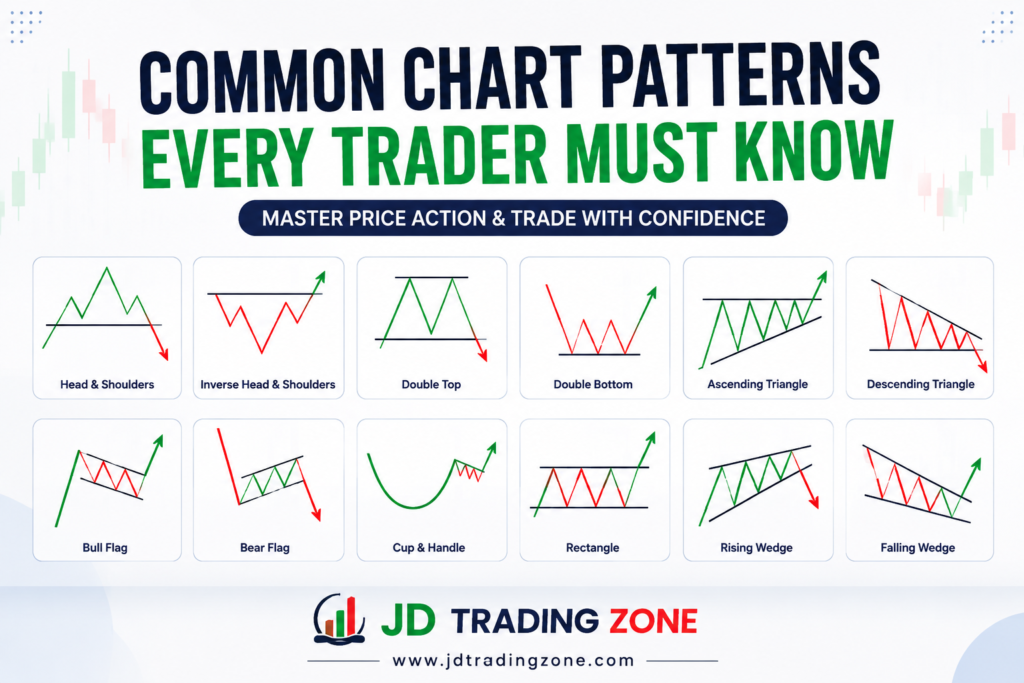
Common Chart Patterns Every Trader Must Know
What Are Chart Patterns?
Chart patterns are shapes formed by the movement of a stock’s price on a chart.
These patterns are created because buyers and sellers repeatedly behave in similar ways.
Instead of predicting the future with certainty, chart patterns help traders estimate the probability of what may happen next.
Think of chart patterns as road signs—they don’t guarantee the destination, but they provide useful direction.
Why Are Chart Patterns Important?
• Identify trend reversals
• Spot trend continuation
• Find better entry points
• Plan stop-loss levels
• Set realistic profit targets
• Improve risk management
• Avoid emotional trading
They become even more effective when combined with:
• Volume analysis
• Support and resistance
• Moving averages
• VWAP
• RSI
• MACD
Two Types of Chart Patterns
There are two main categories.
1. Reversal Patterns
These indicate that the current trend may end and reverse.
Example:
• Uptrend → Downtrend
• Downtrend → Uptrend
2. Continuation Patterns
These indicate that the current trend will likely continue after a short pause.
Example:
• Uptrend → Small consolidation → Uptrend continues
1. Head and Shoulders Pattern
This is one of the strongest bearish reversal patterns.
→ Structure
• Left Shoulder
• Head
• Right Shoulder
• Neckline
When the price breaks below the neckline with strong volume, it often signals the beginning of a downtrend.
→ Best Used In
End of an uptrend
→ Entry
Sell after neckline breakdown.
→ Stop Loss
Above the right shoulder.
2. Inverse Head and Shoulders
This is the bullish version of the previous pattern.
It appears after a downtrend.
Once price breaks above the neckline, buyers often gain control.
→ Best Used In
End of a downtrend
→Entry
Buy after neckline breakout.
→ Stop Loss
Below the right shoulder.
3. Double Top
The Double Top is a bearish reversal pattern.
The price attempts to break the same resistance twice but fails.
This shows buyers are losing strength.
→ Characteristics
• Two equal highs
• Strong resistance
• Neckline support
→ Signal
Sell after neckline breakdown.
4. Double Bottom
This is the opposite of the Double Top.
It signals a possible bullish reversal.
The market forms two similar lows before moving higher.
→ Entry
Buy after resistance breakout.
5. Triple Top
A Triple Top forms when price tests resistance three times but cannot break it.
This indicates strong selling pressure.
It is considered a bearish reversal pattern.
6. Triple Bottom
This is the bullish version of the Triple Top.
The market tests support three times before moving upward.
7. Ascending Triangle
An Ascending Triangle is usually a bullish continuation pattern.
→ Characteristics
• Flat resistance
• Rising support line
• Higher lows
Buyers keep pushing prices higher until resistance breaks.
→ Entry
Buy after breakout with good volume.
8. Descending Triangle
Usually a bearish continuation pattern.
→ Characteristics
• Flat support
• Lower highs
A breakdown below support often leads to further selling.
9. Symmetrical Triangle
A Symmetrical Triangle shows market indecision.
Neither buyers nor sellers are in complete control.
Eventually, price breaks either upward or downward.
Always wait for breakout confirmation.
10. Bull Flag
A Bull Flag is a continuation pattern.
It consists of:
• Strong upward move
• Small downward consolidation
• Breakout
This pattern often appears during strong bullish trends.
11. Bear Flag
Opposite of the Bull Flag.
It forms during a downtrend.
After a small upward pullback, price often continues lower.
12. Cup and Handle
One of the most popular bullish continuation patterns.
→Structure
• Rounded cup
• Small handle
• Breakout
It usually indicates accumulation before another upward move.
13. Rectangle Pattern
Price moves between support and resistance for some time.
This represents consolidation.
Eventually, the breakout direction often determines the next trend.
14. Wedge Pattern
There are two types.
→ Rising Wedge
Usually bearish.
→ Falling Wedge
Usually bullish.
These patterns indicate weakening momentum before a breakout.
Why Volume Matters
Never trade chart patterns without checking volume.
A breakout with strong volume has a higher probability of success.
Weak volume may indicate a false breakout.
A simple rule:
• Breakout + High Volume = Better confirmation
• Breakout + Low Volume = Be cautious
Common Mistakes Beginners Make
Many traders lose money because they misuse chart patterns.
Avoid these mistakes:
• Trading before breakout
• Ignoring volume
• Forgetting stop-loss
• Trading every pattern
• Ignoring the overall market trend
• Risking too much capital on one trade
• Believing patterns work 100% of the time
Tips to Improve Pattern Trading
• Wait for breakout confirmation.
• Use volume as confirmation.
• Trade in the direction of the larger trend.
• Always use a stop-loss.
• Risk only 1–2% of your capital per trade.
• Practice on historical charts before trading with real money.
• Combine chart patterns with support and resistance for better accuracy.
Which Chart Pattern Is Best?
There is no single “best” chart pattern.
Some traders prefer:
• Head and Shoulders for reversals
• Cup and Handle for swing trading
• Bull Flag for trend continuation
• Ascending Triangle for breakout trading
The best pattern is the one you understand, test, and follow consistently.
Frequently Asked Questions (FAQs)
Are chart patterns accurate?
→ Chart patterns improve the probability of successful trades but do not guarantee profits. Always use proper risk management.
Which chart pattern is easiest for beginners?
→ Double Top, Double Bottom, and Ascending Triangle are among the easiest patterns to recognize.
Can chart patterns be used in intraday trading?
→ Yes. They work on intraday, swing, and positional trading charts, but lower timeframes may produce more false signals.
Should I use indicators with chart patterns?
→ Yes. Combining chart patterns with volume, VWAP, RSI, MACD, or moving averages can improve confirmation.
Do chart patterns work in all markets?
→ Yes. They can be used in stocks, indices, commodities, forex, and cryptocurrencies because they are based on price action and market psychology.
Common Chart Patterns Every Trader Must Know
Chart patterns are an essential part of technical analysis and can help traders identify potential trading opportunities with greater confidence. However, no pattern is perfect. Success comes from combining chart patterns with volume analysis, trend analysis, risk management, and disciplined execution.
If you’re just starting, focus on mastering a few reliable patterns such as the Double Bottom, Double Top, Ascending Triangle, and Bull Flag before moving on to more advanced setups. Practice regularly on historical charts, follow a trading plan, and remember that consistency is more important than chasing every market move.
Pingback: 100 Stock Market Terms Every Beginner Should Know - jdtradingzone.com
Pingback: Best Candlestick Patterns for Intraday Trading - jdtradingzone.com