
Also check:- (Best Time to Trade in the Indian Stock Market) (Why Good Trading Setups Fail: 9 Reasons Behind Losing Trades) (One Complete Intraday Trading Setup) (Opening Range Breakout Strategy: A Practical Guide for Intraday Traders in India) (How to Choose Stocks for Intraday Trading in India)
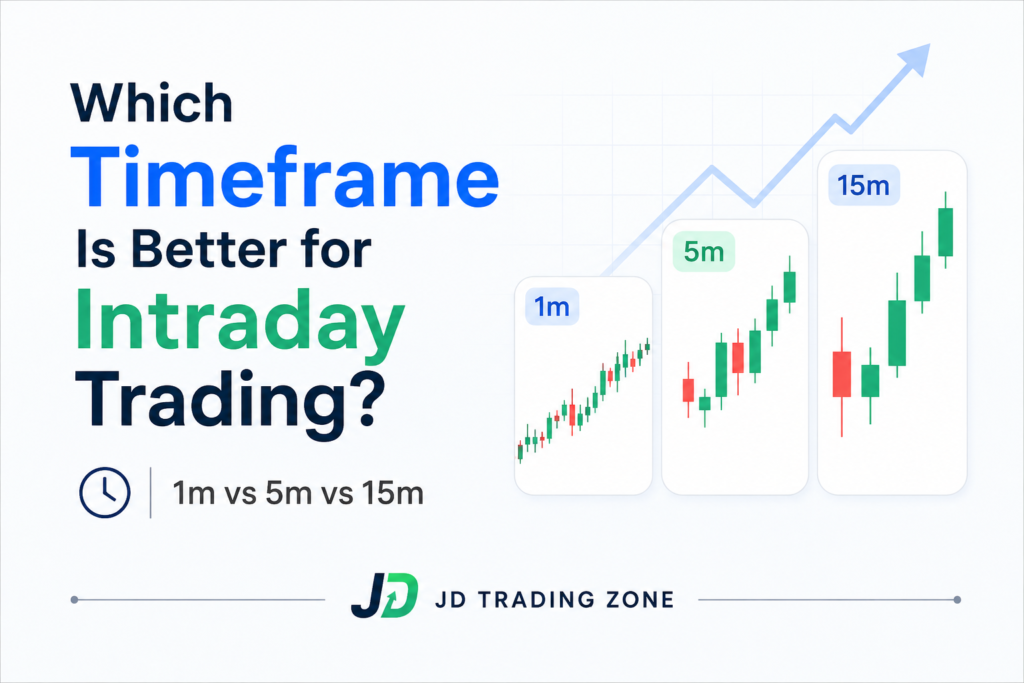
Which Timeframe Is Better for Intraday Trading?
There is no single timeframe that is automatically the best for every intraday trader.
A trader using a 1-minute chart is looking at the market differently from someone using a 15-minute chart. The first trader may be trying to capture a very small price movement, while the second may be waiting for a broader intraday structure to develop.
For most beginners, however, 5-minute and 15-minute charts are practical starting points. The 15-minute chart can help identify the broader intraday structure, while the 5-minute chart can provide more detailed entry and exit information.
The important point is this:
A timeframe should match your trading plan, not your desire for more signals.
This distinction is often overlooked. Many new traders keep moving from 1-minute to 5-minute, then 15-minute and back again whenever a trade goes wrong. The problem is usually not the timeframe itself. It is the absence of a consistent process.
This guide explains how different timeframes behave, where each one can be useful, and how an Indian intraday trader can build a simple multi-timeframe approach.
What Does a Trading Timeframe Actually Mean?
A timeframe determines how much market activity is compressed into one candle.
For example:
• On a 1-minute chart, one candle represents one minute.
• On a 5-minute chart, one candle represents five minutes.
• On a 15-minute chart, one candle represents fifteen minutes.
• On a 30-minute chart, one candle represents thirty minutes.
The shorter the timeframe, the more candles you see during the session.
For example, NSE’s normal equity market runs from 9:15 AM to 3:30 PM, giving a 375-minute regular session.
That means, approximately:
Timeframe
• 1-minute
• 5-minute
• 15-minute
• 30-minute
• 60-minute
Approx. candles in regular session
• 375
• 75
• 25
• 12–13
• 6–7
This difference matters because every additional candle creates another piece of information to interpret.
But more information isn’t necessarily better information.
Sometimes more candles simply mean more noise.
Why Your Timeframe Matters So Much
Imagine a stock moves like this:
₹500 → ₹504 → ₹501 → ₹506 → ₹503 → ₹510
On a 1-minute chart, this movement could produce several apparent breakouts and reversals.
On a 15-minute chart, much of that movement could appear as one candle with a relatively simple message:
Buyers eventually managed to push the price higher.
This is why timeframe selection changes your perception of the market.
A shorter timeframe gives you:
• More signals
• More candles
• Faster entries
• Faster exits
• More market noise
• More opportunities to overtrade
A higher timeframe generally gives you:
• Fewer signals
• Larger candles
• More visible structure
• Slower confirmation
• Less sensitivity to tiny price movements
Educational material from Zerodha also highlights this trade-off: shorter intervals provide more data points, but traders need to distinguish useful information from noise.
1-Minute Chart: Is It Good for Intraday Trading?
The 1-minute chart is attractive because everything happens quickly.
You can see a large number of candles during the session, and small price movements become highly visible.
But that is also its biggest weakness.
A small fluctuation that looks important on a 1-minute chart may have very little significance on a 15-minute chart.
Advantages of the 1-minute chart
• Very precise entry timing
• Useful for experienced scalpers
• Quickly reflects short-term momentum
• Can help refine an entry after a setup is already identified
Disadvantages
• Considerable market noise
• Frequent false breakouts
• More emotional pressure
• More temptation to enter every small movement
• Easy to overtrade
The 1-minute chart is therefore not my preferred starting point for a beginner.
If you are still learning support and resistance, trend structure, volume, VWAP or risk management, adding a 1-minute chart can make the learning process unnecessarily complicated.
Who can consider it?
Experienced scalpers who already have:
• A clearly defined setup
• Strict stop-loss rules
• Fast execution
• A tested trading plan
• The discipline to ignore mediocre signals
The mistake is not using a 1-minute chart.
The mistake is using it without a reason.
5-Minute Chart: The Practical Intraday Workhorse
If someone asks me to choose one timeframe for active intraday analysis, the 5-minute chart is one of the first I would consider.
It offers a useful middle ground.
You get considerably more information than a 15-minute chart while avoiding some of the extreme noise found on a 1-minute chart.
Zerodha’s educational material lists 5-minute charts among standard intraday timeframes, while other current educational resources similarly identify 5-minute charts as a common choice for active intraday execution.
Why traders like the 5-minute chart
It can be useful for:
• Breakout entries
• Pullback entries
• VWAP-based setups
• Moving-average setups
• Intraday support and resistance
• Short-term momentum trades
For example, suppose a stock opens at ₹820 and establishes an intraday resistance near ₹830.
Instead of buying simply because the price touches ₹830, a trader could wait for a 5-minute candle to close above the level, then evaluate:
• Volume
• Market direction
• VWAP position
• Candle structure
• Nearby resistance
• Stop-loss distance
The timeframe does not create the trade.
It simply gives you a framework for reading the trade.
15-Minute Chart: Better for Seeing the Bigger Intraday Picture
The 15-minute chart removes much of the smaller price movement that appears on lower timeframes.
This makes it particularly useful for understanding:
• Intraday trend
• Major support and resistance
• Breakout structure
• Consolidation
• Higher highs and higher lows
• Lower highs and lower lows
For a beginner, this can be easier to understand than watching dozens of tiny candles.
A 15-minute candle contains three times as much time as a 5-minute candle, so individual short-term fluctuations have less visual influence.
That doesn’t mean every 15-minute signal is more profitable. It simply means the chart presents price action at a slower level of detail.
Zerodha notes that higher-timeframe signals can generally be more reliable than signals on very short intervals, while also emphasizing that the chosen timeframe should correspond to the intended trade duration.
5-Minute vs 15-Minute: Which One Is Better?
This is probably the question most new intraday traders actually want answered.
My practical answer:
Use the 15-minute chart for context and the 5-minute chart for execution.
Instead of trying to decide that one timeframe must replace the other, give each one a specific job.
For example:
15-minute chart → What is the market doing?
5-minute chart → Where can I potentially enter?
This approach prevents you from making a decision based only on one small candle.
Example: 15-Minute + 5-Minute Approach
Suppose you are watching a liquid stock.
On the 15-minute chart:
• Price is above VWAP.
• The structure is making higher highs and higher lows.
• Resistance is visible near ₹1,250.
You don’t immediately buy.
You move to the 5-minute chart.
The stock pulls back toward a previously broken level around ₹1,238.
Then:
• Selling pressure slows.
• A bullish candle forms.
• Volume improves.
• Price remains above VWAP.
Now the 5-minute chart is helping with execution while the 15-minute chart provides the larger context.
This is far more structured than continuously switching between five different timeframes looking for a reason to trade.
What About the 30-Minute Chart?
The 30-minute chart is slower and produces fewer candles.
That can be useful if you don’t want to react to every small movement.
It can help identify:
• The broader intraday trend
• Major price zones
• Larger consolidations
• Important breakout levels
However, it may be too slow for traders who take several short-duration trades during the day.
A 30-minute candle can also make your entry appear late if your strategy depends on small intraday movements.
So I would generally treat the 30-minute chart as a context timeframe, rather than automatically using it as an entry chart.
Should You Use a 1-Hour Chart for Intraday Trading?
Yes, but usually for context rather than precise entries.
A 1-hour chart can help answer a different question:
“Where is today’s price sitting inside the larger market structure?”
For example, a stock may look strongly bullish on a 5-minute chart.
But the 1-hour chart might show that price is approaching a major resistance zone created over several previous sessions.
That information can change how aggressively you want to trade the 5-minute setup.
This is one reason multi-timeframe analysis can be useful.
A Simple Timeframe Framework for Beginners
If you are new to intraday trading, don’t start with six charts.
Start with three.
Chart 1: 15-minute
Use it for:
• Trend
• Major levels
• Market structure
• Key breakout zones
Chart 2: 5-minute
Use it for:
• Setup formation
• Entry
• Stop-loss placement
• Trade management
Chart 3: 1-minute — Optional
Use it only if you have a genuine reason to refine execution.
If you’re constantly watching the 1-minute chart and changing your decision every few seconds, remove it.
Why Shorter Timeframes Can Create More Trading Mistakes
One of the biggest traps for new traders is believing:
More candles = more opportunities = more profit.
The first part is true.
The last part isn’t guaranteed.
Suppose your strategy produces a valid setup only a few times a day.
On a 1-minute chart, you may see dozens of movements that look almost like your setup.
You start thinking:
“Maybe this is a breakout.”
Then:
“Maybe this is a reversal.”
Then:
“Maybe I should enter.”
This is how overtrading starts.
The problem isn’t necessarily the chart.
It’s the trader’s response to the chart.
Timeframe and Stop-Loss: An Important Connection
Your timeframe also affects how you interpret a stop-loss.
Consider a stock trading at ₹500.
On a 1-minute setup, you might identify a nearby swing low at ₹498.
On a 15-minute setup, the meaningful swing low could be ₹494.
Those are completely different structures.
If you randomly use a ₹2 stop-loss simply because you want a small risk, you may place the stop inside normal market noise.
A better approach is:
Find the invalidation level first → calculate position size second.
Not:
Choose position size first → force the stop-loss around it.
This is a fundamental risk-management principle that is more important than choosing between 5-minute and 15-minute charts.
Timeframe and Risk-to-Reward Ratio
The same setup can look completely different depending on the chart.
Imagine:
• Entry: ₹500
• Stop-loss: ₹495
• Target: ₹515
Risk = ₹5
Potential reward = ₹15
That’s a 1:3 risk-to-reward ratio.
But if you enter using a smaller timeframe and place the stop at ₹498, the trade may look like a 1:7 setup.
That doesn’t automatically make it better.
If ₹498 is inside normal price fluctuation, the trade may simply have a higher probability of hitting the stop before the move develops.
A smaller stop isn’t automatically a smarter stop.
Does a Higher Timeframe Give More Accurate Signals?
Not automatically.
This is an important distinction.
A higher timeframe can reduce some short-term noise, but it does not eliminate:
• False breakouts
• News-driven movements
• Poor liquidity
• Bad risk management
• Weak trading setups
• Unexpected market events
A 15-minute breakout can fail just as a 5-minute breakout can fail.
The difference is that you are observing a different amount of price information in each candle.
Therefore, never interpret:
“Higher timeframe = guaranteed better trades.”
Instead think:
“Higher timeframe = different information.”
How I Would Choose a Timeframe for an Intraday Setup
Rather than asking:
“Which timeframe is best?”
Ask these five questions.
1. How long do I expect to hold the trade?
If you expect to hold for 10–20 minutes, a 60-minute entry chart may be unnecessarily slow.
If you expect to hold for several hours, a 1-minute chart may provide too much noise.
2. What does my strategy need?
A VWAP pullback strategy may work well with 5-minute candles.
A larger breakout strategy may benefit from 15-minute confirmation.
A scalping strategy may require a much shorter chart.
The strategy should influence the timeframe.
3. How much noise can I handle?
If you repeatedly change your decision after every small candle, your timeframe may be too fast for your current experience.
Slowing down can sometimes improve decision-making more than adding another indicator.
4. How many trades does the strategy actually need?
If your plan requires only one or two quality trades per session, there is little reason to watch every tiny movement.
The goal is not to trade every opportunity.
The goal is to trade your opportunity.
5. Have I tested the timeframe?
This is the most important question.
Don’t change your timeframe because someone on social media says:
“5-minute chart is the best.”
Backtest and journal the same strategy across different timeframes.
Record:
• Number of trades
• Win rate
• Average reward/risk
• Maximum losing streak
• Average holding time
• Number of false entries
• Profit after costs
• Emotional difficulty
Then compare the results.
Practical 15-Minute + 5-Minute Setup
Here is a simple educational framework that can be tested rather than blindly followed.
Step 1: Start with the 15-minute chart
Mark:
• Previous day’s high
• Previous day’s low
• Important support
• Important resistance
• VWAP
• Current intraday structure
Don’t enter yet.
Step 2: Determine the environment
Ask:
Is price trending, consolidating or moving randomly?
A trending market and a sideways market require different expectations.
Step 3: Move to the 5-minute chart
Wait for your predefined setup.
For example:
• Pullback
• Breakout
• Rejection
• VWAP reclaim
• Support/resistance reaction
Don’t create a new setup simply because the 5-minute chart is moving.
Step 4: Define invalidation
Before entering, know:
“At what price would my trade idea be wrong?”
That level should determine your stop-loss.
Step 5: Calculate position size
Risk a predefined amount rather than randomly choosing the number of shares.
For example:
If your maximum planned risk is ₹500 and your entry-to-stop distance is ₹5:
Position size = ₹500 ÷ ₹5 = 100 shares
This is an educational example, not a recommendation for a particular stock or trade.
Step 6: Manage the trade
Once you’re in, don’t continuously change the plan because one candle looks scary.
Let your predefined rules manage the trade.
What Timeframe Should Beginners Avoid?
I wouldn’t say beginners must completely avoid a particular timeframe.
But I would be cautious about starting with 1-minute charts.
The speed can make beginners:
• Enter too frequently
• Exit too early
• Move stop-losses
• Chase breakouts
• Revenge trade
• Overreact to normal fluctuations
A slower chart can make it easier to learn market structure first.
Once you can consistently follow your trading rules, you can experiment with faster execution.
Best Timeframe for Nifty and Bank Nifty Intraday Trading
For index-focused intraday traders, a practical starting framework can be:
15-minute → market structure
5-minute → setup and execution
1-minute → optional entry refinement
The exact combination should still be tested on your particular strategy.
For example, a trader using VWAP + price action may find 5-minute charts comfortable, while another trader using a slower breakout setup may prefer 15-minute candles.
Don’t assume that because a timeframe works for Nifty it will behave identically on every stock.
Different instruments have different volatility and liquidity characteristics.
What About the First 15 Minutes of the Market?
This is another area where traders often confuse time of day with chart timeframe.
A 5-minute chart does not mean you should automatically trade every 5-minute candle from 9:15 AM.
The Indian equity market’s normal session begins at 9:15 AM and ends at 3:30 PM.
The opening period can produce rapid price movement because the market is processing overnight information, gaps and fresh orders.
Instead of automatically trading the first candle, you can make the opening period part of your plan.
For example:
9:15–9:30: Observe and identify the opening range.
After 9:30: Look for your predefined setup.
This is not a universal rule. Some experienced traders specifically trade opening volatility. The important point is that your decision should come from a tested strategy rather than a blanket rule.
One Mistake: Changing Timeframe After Every Losing Trade
This is one of the most damaging habits I’ve seen among developing traders.
Imagine:
Trade 1: 5-minute setup loses.
Trader thinks:
“5-minute doesn’t work.”
Changes to 15-minute.
Trade 2: 15-minute setup loses.
“Maybe 15-minute is too slow.”
Changes to 1-minute.
Trade 3: 1-minute setup loses.
“Maybe I need a different indicator.”
Then the trader changes the strategy.
After several weeks, they have tested nothing properly.
The better approach is to keep one framework long enough to collect meaningful data.
A losing trade doesn’t automatically prove that the timeframe is wrong.
The Real Problem May Not Be Your Timeframe
Before changing your chart, check these areas:
Market selection
Are you trading liquid instruments?
Setup quality
Did your entry actually meet your rules?
Risk management
Was your stop-loss logical?
Position sizing
Was the position too large?
Trading hours
Are you forcing trades during low-quality periods?
Discipline
Did you follow the plan?
Market condition
Was the strategy designed for a trending market while you traded a sideways one?
These factors can have a much greater impact on results than whether your chart says 5 minutes or 15 minutes.
My Practical Timeframe Recommendation
If you’re a beginner learning intraday trading, I would keep it simple:
Primary chart: 15-minute
Use it to understand:
• Trend
• Structure
• Major levels
• Important zones
• Execution chart: 5-minute
Use it to identify:
• Entry
• Stop-loss
• Breakout confirmation
• Pullback
• Trade management
Optional: 1-minute
Only use it after you already have a valid setup.
Don’t let the 1-minute chart decide your entire trading direction.
A Simple Rule to Remember
You can remember the entire article with this:
Higher timeframe tells you the story.
Lower timeframe helps you time the entry.
For many intraday traders, a combination such as 15-minute + 5-minute provides enough information without forcing them to monitor an excessive number of candles.
But the “best” timeframe is ultimately the one that fits your strategy, holding period, risk management and ability to follow rules consistently.
Frequently Asked Questions
Is 5-minute or 15-minute better for intraday trading?
Neither is universally better.
The 15-minute chart is generally useful for broader intraday structure, while the 5-minute chart provides more detailed entry information. Using both together can be more practical than choosing only one.
Is the 1-minute chart good for beginners?
Usually, it is not the easiest place to start.
The large number of candles and rapid price changes can encourage overtrading. Beginners may find a 5-minute or 15-minute framework easier to manage.
Which timeframe is best for scalping?
Very short timeframes such as 1-minute or 3-minute charts can be used by experienced scalpers, but the appropriate timeframe depends on the strategy, execution speed and risk controls.
Which timeframe is best for Nifty intraday trading?
A practical starting combination is the 15-minute chart for context and 5-minute chart for execution. However, this should be tested with your specific Nifty strategy rather than treated as a guaranteed formula.
Can I use only the 15-minute chart?
Yes.
You don’t need multiple timeframes to trade.
A trader can build a complete system using one timeframe if the rules for setup, entry, stop-loss and exit are clearly defined.
Can I use only the 5-minute chart?
Yes.
The 5-minute chart can provide enough information for many intraday strategies. The disadvantage is that you may miss some broader context that would be easier to see on a higher timeframe.
Does a higher timeframe reduce losses?
Not necessarily.
Higher timeframes may reduce some market noise, but losing trades can still occur. Risk management and strategy quality remain essential.
How many timeframes should an intraday trader use?
For a beginner, two timeframes are often enough.
For example:
15-minute = context
5-minute = execution
Adding more charts isn’t automatically an improvement.
Pingback: How to Plan an Intraday Trade Before the Market Opens - jdtradingzone