
If you have ever watched an Indian stock shoot up just after 9:30 AM and thought, “I should have entered there,” you have probably seen an Opening Range Breakout (ORB) in action.
The idea behind ORB is simple: instead of trying to predict the market direction immediately after the opening bell, you first let the market establish a small range. You then use that range as a reference point and wait for the price to show a meaningful breakout.
But there is an important difference between trading an opening range breakout and simply buying the first green candle that moves above the morning high.
That difference is where many beginners lose money.
This guide explains the ORB strategy using a practical approach for Indian markets, including how to define the opening range, identify stronger breakouts, avoid common traps, place a stop-loss, calculate position size, and review the setup afterward.
Important: ORB is a trading framework, not a guaranteed-profit strategy. Breakouts can fail quickly, especially during choppy or news-driven sessions. Always control your risk and test a setup before using real money.
Also check:- (How to Choose Stocks for Intraday Trading in India) (Volume and Price Action Trading Strategy) (Breakout Retest Strategy Explained) (How to Confirm a Breakout Before Taking a Trade)
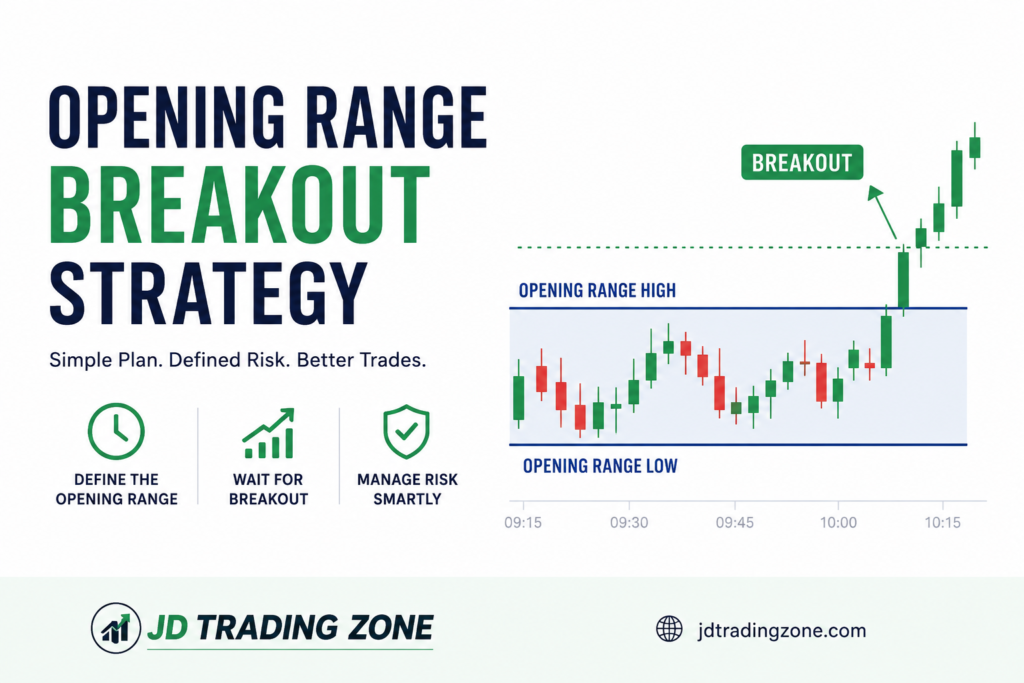
What Is the Opening Range Breakout Strategy?
The Opening Range Breakout strategy, commonly called ORB, is an intraday trading method based on the high and low formed during a predefined period after the market opens.
For Indian equities, the regular NSE equity market opens at 9:15 AM IST. A trader might define the first 15 minutes, from 9:15 to 9:30 AM, as the opening range.
Two levels are then marked:
• Opening Range High (ORH): highest price during the selected period
• Opening Range Low (ORL): lowest price during the selected period
After the range is established, the trader waits.
If price convincingly moves above ORH, it may create a bullish ORB setup.
If price convincingly moves below ORL, it may create a bearish ORB setup.
The important word is convincingly.
A temporary wick above the range is not automatically a high-quality breakout.
Why Does the Opening Range Matter?
The first part of a trading session can be unusually active because the market is processing overnight information, new orders and changing expectations.
Instead of attempting to interpret every tick, ORB gives the trader two simple reference levels.
Think of the opening range as a small battlefield.
Buyers are trying to push price through the upper boundary.
Sellers are defending the lower boundary.
The eventual break can provide information about which side is gaining short-term control.
However, this does not mean every opening range will produce a trend.
Some sessions simply remain trapped between the two levels.
That is why an ORB trader should be comfortable doing nothing.
15-Minute ORB vs 5-Minute ORB vs 30-Minute ORB
There is no universally “best” opening-range period.
Different windows change the character of the setup.
5-Minute ORB
The range is created from approximately 9:15 to 9:20 AM.
Advantages:
• Earlier signals
• More opportunities
• Useful for traders looking for fast momentum
Disadvantages:
• More noise
• Smaller ranges can be broken easily
• Greater probability of false breakouts
A 5-minute ORB can look attractive because it produces an early entry, but early does not automatically mean better.
15-Minute ORB
The range is created from approximately 9:15 to 9:30 AM.
This is a practical starting point for beginners because it gives the market more time to establish its initial structure.
Advantages:
• More information than a 5-minute range
Easy to mark manually
• Works well with a 5-minute confirmation candle
• Helps reduce some early-market noise
Disadvantages:
• Entry comes later
• Very fast moves may already have started
30-Minute ORB
The range is created from approximately 9:15 to 9:45 AM.
This produces a wider range and generally requires a larger price move before a breakout occurs.
Advantages:
• More time for initial volatility to settle
• Fewer premature signals
Disadvantages:
• Later entry
• Wider range can make stop-loss placement more expensive
For someone learning ORB, 15 minutes is a reasonable starting framework, but it should not be treated as a magic setting.
My Simple 15-Minute ORB Framework
Here is a practical framework that can be tested on liquid Indian stocks.
Step 1: Wait for the market to open
Do not immediately enter a trade at 9:15 AM simply because the first candle is strongly bullish or bearish.
Let the opening range form.
Step 2: Mark the range
After 9:30 AM, mark:
ORH = high of the 9:15–9:30 range
ORL = low of the 9:15–9:30 range
Now you have your two important levels.
Step 3: Wait for confirmation
For a bullish setup, wait for a candle to close above ORH.
For a bearish setup, wait for a candle to close below ORL.
This is different from entering the moment price briefly crosses the level.
Step 4: Check the context
Before entering, ask:
• Is the stock liquid?
• Is the breakout candle reasonably strong?
• Is volume supporting the move?
• Is the broader market moving in the same direction?
• Is the stock already extremely extended?
• Is there an obvious resistance/support level immediately ahead?
• Is the risk acceptable?
If several answers are unfavorable, skipping the trade may be the better decision.
A Realistic Example
Suppose a stock opens at ₹500.
During the first 15 minutes:
• High = ₹506
• Low = ₹498
Therefore:
Opening Range High = ₹506
Opening Range Low = ₹498
At 9:35 AM, the stock moves toward ₹506.
A weak approach would be:
“It touched ₹506, so buy immediately.”
A more disciplined approach is to wait for confirmation.
Suppose a 5-minute candle closes at ₹508 with noticeably stronger volume.
Now the breakout has more evidence behind it.
If the planned entry is ₹508 and your chosen stop is ₹498, your initial risk is:
₹508 − ₹498 = ₹10 per share
If your trading plan requires a 1:2 reward-to-risk objective, the theoretical target would be:
₹508 + (₹10 × 2) = ₹528
But there is an important point here:
You should not blindly hold for ₹528 if a major resistance level sits at ₹515.
The chart’s structure matters more than mechanically applying a formula.
The Most Important Part: Position Size
Many beginners focus on finding the perfect entry.
Experienced risk management starts somewhere else:
How much can I afford to lose if this trade fails?
Suppose your trading capital is ₹1,00,000 and you decide to risk only 0.5% on one trade.
Maximum planned loss:
₹1,00,000 × 0.5% = ₹500
Suppose your entry is ₹508 and your stop-loss is ₹498.
Risk per share:
₹10
Approximate position size:
₹500 ÷ ₹10 = 50 shares
So instead of deciding:
“I will buy 500 shares because the breakout looks strong.”
you first calculate the acceptable loss and then determine the position size.
This approach prevents one bad breakout from becoming a disproportionately large hit to the account.
What Makes an ORB Breakout More Interesting?
A breakout becomes more meaningful when several pieces of evidence point in the same direction.
1. Volume Expansion
A breakout accompanied by stronger-than-usual volume can provide additional confirmation that participation has increased.
But volume should be treated as confirmation, not proof.
High volume can also occur during a failed breakout.
2. Price Closes Beyond the Level
A wick above ORH followed by a close back inside the range is very different from a candle that closes comfortably above ORH.
This is why waiting for candle confirmation can help reduce impulsive entries.
3. Market Direction
Suppose your stock produces a bullish ORB while the broader market is also showing strength.
That alignment may be more attractive than a stock breaking upward while the overall market is aggressively falling.
It does not guarantee success.
It simply gives you more context.
4. Sector Strength
Imagine a banking stock breaking its opening range high while the banking sector is also showing strength.
That may be more interesting than an isolated breakout in a weak sector.
The idea is simple:
Look at the stock, then zoom out.
5. VWAP Alignment
VWAP can be used as an additional context filter.
For example:
Bullish ORB idea:
• Price breaks ORH
• Price remains above VWAP
• Volume expands
• Market/sector is supportive
A bearish setup can use the opposite conditions.
The purpose is not to create ten indicators around one trade.
The purpose is to avoid taking every breakout blindly.
The ORB Retest: An Alternative Entry
One of the most useful variations is waiting for a retest.
Suppose:
ORH = ₹506
Price breaks above ₹506 and moves to ₹511.
Instead of chasing ₹511, you wait to see whether price returns toward ₹506.
If price tests the old resistance and buyers defend it, the previous resistance may begin behaving like short-term support.
For example:
₹506 → breakout → ₹511 → pullback → ₹506–₹507 → buyers return
That can create a more structured entry than chasing the first large candle.
However, not every breakout retests neatly.
Sometimes the price simply runs away.
A trader must therefore decide beforehand whether the plan is:
Breakout entry, retest entry, or no trade.
Mixing rules randomly during a live trade usually creates confusion.
What About a False Breakout?
This is where ORB becomes much more interesting.
Suppose:
• ORH = ₹506
• Price moves to ₹509
• Traders enter long
• Price suddenly falls back below ₹506
The breakout has failed.
This is commonly called a false breakout or failed breakout.
The worst response is:
“It will come back. I will just wait.”
That turns a planned trading loss into an uncontrolled position.
Your stop-loss should be decided before entering.
A failed breakout is not a personal failure.
It is simply one possible outcome of the setup.
A Useful ORB Filter: Avoid Extremely Wide Opening Ranges
Imagine two stocks.
Stock A
Opening range:
₹500–₹504
Range size = ₹4
Stock B
Opening range:
₹500–₹525
Range size = ₹25
A breakout of Stock B may require a much larger move to produce a reasonable reward relative to the risk.
This is why the size of the opening range deserves attention.
A very wide range can make the setup unattractive even if the breakout itself looks exciting.
The goal is not:
“Find a breakout.”
The goal is:
“Find a breakout where the potential trade makes sense relative to the risk.”
When I Would Skip an ORB Trade
A strong ORB strategy should include rules for not trading.
Consider skipping when:
1. The opening range is unusually wide
The stop may become too large.
2. Price keeps jumping above and below ORH
This indicates indecision rather than clean directional control.
3. The breakout happens directly into major resistance
There may not be enough room for the trade to develop.
4. Volume does not support the move
A weak breakout can be easier to reverse.
5. The stock is illiquid
Wide spreads and poor execution can damage an otherwise good-looking setup.
6. You already took multiple losses
The market does not owe you a winning trade.
Do not increase position size simply because you want to recover the previous loss.
7. A major news event is creating abnormal volatility
Price can move too quickly for a clean ORB structure to behave normally.
ORB and Risk-to-Reward
A strategy does not need to win every trade to be useful.
For example, imagine a trader risks ₹500 on each trade.
Five trades produce:
Trade 1: +₹1,000
Trade 2: -₹500
Trade 3: -₹500
Trade 4: +₹1,000
Trade 5: -₹500
Total:
+₹500
The trader won only 2 out of 5 trades, yet the sequence was still profitable before costs.
This is why judging ORB only by its win rate can be misleading.
Track at least:
• Win rate
• Average winning trade
• Average losing trade
• Maximum losing streak
• Average R multiple
• Brokerage and other trading costs
Slippage
• Number of trades taken
Your actual results matter more than someone else’s claimed win rate.
A Simple ORB Trading Checklist
Before entering a trade, ask:
• [ ] Is the opening range clearly defined?
• [ ] Am I trading only after my predefined range period?
• [ ] Did price actually break ORH or ORL?
• [ ] Did the candle close beyond the level?
• [ ] Is volume supportive?
• [ ] Is the broader market supportive?
• [ ] Is the sector supportive?
• [ ] Is there enough room before the next major level?
• [ ] Is my stop-loss already defined?
• [ ] Is my position size based on risk?
• [ ] Is the potential reward reasonable?
• [ ] Am I entering because of my setup or because I fear missing the move?
That final question is surprisingly important.
Common ORB Mistakes Beginners Make
Mistake 1: Entering before the range is complete
If you define a 15-minute ORB, entering at 9:18 AM defeats the purpose of the setup.
Mistake 2: Buying every breakout
A breakout is not automatically a quality trade.
Context matters.
Mistake 3: Chasing a large candle
A stock that has already moved sharply may offer a poor entry even though the direction is correct.
Mistake 4: Moving the stop-loss
If the original reason for the trade is invalidated, moving the stop simply to avoid taking a loss changes the risk profile.
Mistake 5: Using too many indicators
Adding RSI, MACD, several EMAs, Bollinger Bands and multiple other indicators can make a simple ORB system harder to follow.
Start with price, volume and risk management.
Add filters only when your testing shows they improve the process.
Mistake 6: Ignoring trading costs
A strategy can look profitable on paper but perform differently after brokerage, taxes, slippage and other applicable charges.
How to Backtest the ORB Strategy Properly
Before deciding whether ORB works for you, test it.
Do not simply look at ten historical charts and count the obvious winning trades.
Create fixed rules.
For example:
Market: Liquid NSE stocks
Opening range: First 15 minutes
Confirmation: 5-minute candle close beyond ORH/ORL
Entry: Next available price after confirmation
Stop: Predefined technical level
Target: Fixed R multiple or trailing method
Maximum trades: One or two per session
Exit: Intraday only
Then test a meaningful sample of trades.
Record every eligible setup, including the trades you would rather forget.
That prevents survivorship bias in your analysis.
ORB Is a Framework, Not a Prediction Machine
This is perhaps the most important lesson.
The ORB strategy does not tell you:
“This stock will definitely rise.”
It tells you:
“If price breaks this predefined level under my conditions, I have a setup worth evaluating.”
That difference changes how you approach trading.
You are not trying to predict every move.
You are waiting for a specific market behavior.
If it appears, you act according to your rules.
If it does not appear, you stay out.
Frequently Asked Questions
Is ORB suitable for beginners?
→ It can be easier to understand than strategies involving many indicators because the basic structure uses clearly defined levels. However, beginners should practice with historical data or paper trading before risking real capital.
Which ORB timeframe is best?
→ There is no universal best timeframe. Five-, 15-, and 30-minute opening ranges are commonly used. A 15-minute ORB is a reasonable starting framework for studying Indian intraday markets.
Can ORB be used for NSE stocks?
→ Yes. The strategy can be applied to liquid Indian stocks and index-related instruments, but the rules, liquidity, volatility and transaction costs should be tested separately for each instrument.
Should I use VWAP with ORB?
→ You can use VWAP as a confirmation filter, but it should not be assumed to automatically improve performance. Test ORB alone against ORB + VWAP using the same historical sample.
Does ORB work every day?
→ No.
Some sessions trend strongly after the opening range. Others remain sideways or produce multiple false breaks.
A good ORB trader needs a no-trade condition.
Can ORB be used for options trading?
→ The underlying index or stock can be used to identify the ORB setup, while the option is used for execution. However, options introduce additional variables such as time decay, implied volatility, spread and liquidity. Beginners should understand those risks before using ORB for options.
Final Takeaway
The biggest mistake with the Opening Range Breakout strategy is thinking the strategy is simply:
“Mark the first 15-minute high and low → buy the breakout.”
The real process is more disciplined:
Define the range → wait → confirm the breakout → check context → calculate risk → size the position → manage the trade → record the result.
And sometimes the correct decision is no trade at all.
That is what makes ORB useful as a trading framework.
It gives you a defined area to watch instead of forcing you to predict where the market will go.
If you are learning ORB, start with one fixed opening-range period, one entry rule, one risk model and a trading journal.
Test the complete process over a meaningful sample before deciding whether the strategy fits your trading style.
JD Trading Zone Note: This article is for educational purposes only and should not be treated as financial advice or a recommendation to buy or sell any security. Intraday trading involves substantial risk, and losses can exceed expectations. Always conduct your own research, use appropriate risk management, and follow applicable regulations and broker requirements.
Pingback: One Complete Intraday Trading Setup - jdtradingzone
Pingback: Best Time to Trade in the Indian Stock Market - jdtradingzone