
Hello guys today we will discuss about Volume and Price Action Trading Strategy. A beginner’s complete guide in simple words.
Welcome to JD Trading Zone
Disclaimer: This article is for educational purposes only and should not be considered financial advice. Trading involves risk, and no trading strategy can guarantee profits.
Also check:- (Breakout Retest Strategy Explained) (How to Confirm a Breakout Before Taking a Trade) (How to Identify Market Trend Before Taking a Trade) (Rules of Option Trading for Beginners) (Best Free Websites for Stock Market Analysis)
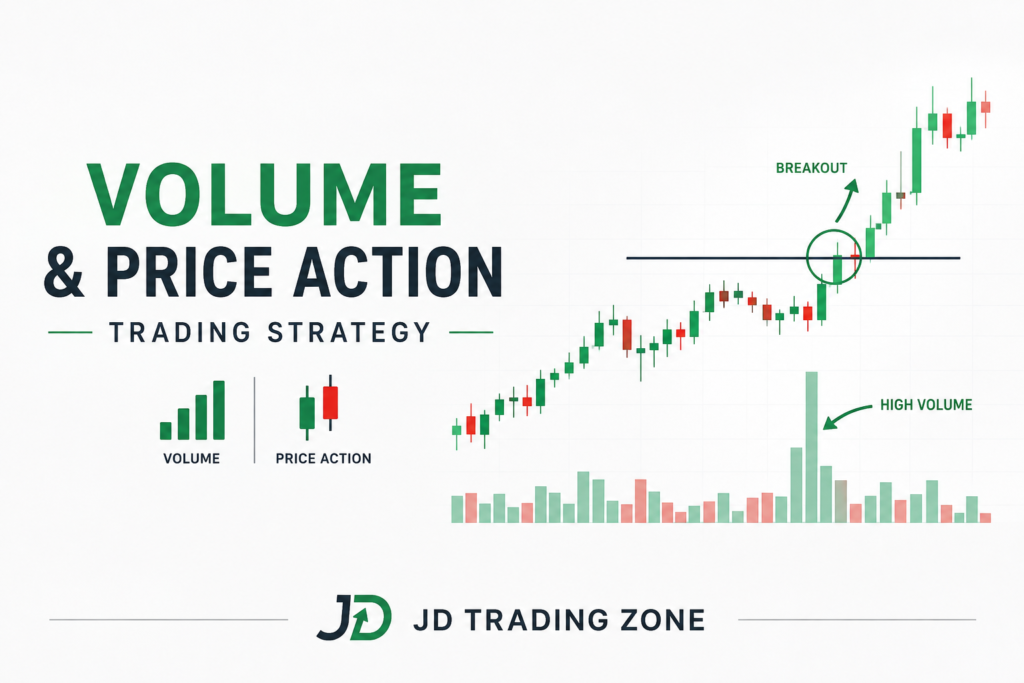
Volume and Price Action Trading Strategy
What Is a Volume and Price Action Trading Strategy?
A volume and price action trading strategy combines two important pieces of market information:
• Price action tells you what price is doing.
• Volume tells you how much trading activity is taking place behind that movement.
Instead of looking at price alone, traders can study whether a price move is supported by meaningful trading activity.
For example, suppose a stock breaks above an important resistance level. The breakout may look attractive on the chart, but one important question remains:
Are buyers actually participating strongly enough to support the move?
Volume can provide additional context.
If price breaks resistance with noticeably higher-than-usual volume, the breakout may have stronger participation than a breakout that occurs on very low volume.
However, volume should not be treated as a magic confirmation tool. High volume can occur during buying, selling, panic, news events, or position exits. The goal is to interpret price and volume together, not use volume in isolation.
Why Combine Price Action and Volume?
Price action is useful because charts show the actual behavior of buyers and sellers.
Volume adds another layer of information.
Consider two breakouts:
Breakout A
• Price moves above resistance.
• Volume remains unusually low.
• The next candle falls back below resistance.
Breakout B
• Price moves above resistance.
• Volume expands compared with recent candles.
• Price closes strongly above the level.
• The next candle holds above the breakout area.
The second setup may provide more evidence that market participation increased around the breakout.
This does not mean the second trade must succeed.
Instead, the combination helps traders build a higher-quality decision-making process.
Understanding Price Action Before Using Volume
Before studying volume, beginners should understand the basic structure of price.
Price action includes:
• Candlestick patterns
• Support and resistance
• Higher highs
• Higher lows
• Lower highs
• Lower lows
• Breakouts
• Retests
• Rejections
• Trend structure
• Consolidation
Example of an Uptrend
An uptrend generally develops when price creates a sequence of:
Higher High → Higher Low → Higher High → Higher Low
This suggests buyers are repeatedly able to push price to new highs while defending previous pullback areas.
Example of a Downtrend
A downtrend generally develops through:
Lower Low → Lower High → Lower Low → Lower High
This indicates that sellers are maintaining control over important price areas.
Volume can then be used to examine how strong the participation appears during these movements.
What Does Volume Actually Tell You?
Volume represents the number of shares, contracts, or units traded during a particular period, depending on the market and instrument.
On most trading platforms, volume appears as vertical bars below the price chart.
Large volume means there was significant trading activity during that period.
Small volume means there was comparatively less activity.
But there is an important distinction:
Volume tells you activity, not direction.
A large volume bar does not automatically mean buyers won.
There can be heavy buying and selling at the same time.
Therefore, you should always ask:
1. Where did the high volume occur?
2. What did price do during that period?
3. Did price break an important level?
4. Did price reject the level?
5. Did the candle close strongly or weakly?
6. What happened after the volume spike?
This is where volume becomes more useful.
The Basic Volume and Price Action Strategy
A simple framework for beginners is:
Market Structure → Important Level → Price Action → Volume Confirmation → Entry → Stop-Loss → Target
Let’s break this down.
Step 1: Identify the Market Structure
First determine whether the market is:
• Trending upward
• Trending downward
• Moving sideways
• Consolidating before a potential breakout
Avoid starting with volume alone.
Ask what the market is doing first.
For example, if price is consistently making higher highs and higher lows, look for potential buying opportunities around meaningful pullback areas rather than randomly buying after every green candle.
Step 2: Mark Important Price Levels
Identify areas where price has previously reacted.
Common levels include:
• Previous swing high
• Previous swing low
• Support
• Resistance
• Previous day’s high
• Previous day’s low
• Consolidation boundaries
• Major breakout levels
A volume signal becomes more meaningful when it occurs around an important price level.
For example:
High volume in the middle of random price movement
may not tell you much.
But:
High volume + breakout of major resistance + strong closing candle
can provide much more useful information.
Step 3: Wait for Price Action
Do not enter simply because volume increases.
Wait for price to show something meaningful.
Examples include:
• Strong breakout candle
• Rejection candle
• Bullish engulfing pattern
• Bearish engulfing pattern
• Breakout followed by retest
• Strong close near the high
• Strong close near the low
The exact candle pattern matters less than its location and context.
A bullish candle in the middle of a range may be less useful than a bullish candle appearing after price successfully retests an important support level.
Step 4: Check Volume
Now compare the current volume with recent volume.
You don’t necessarily need an extremely complicated indicator.
A simple volume histogram can be enough for beginners.
Look for situations such as:
Breakout + Increased Volume
Price breaks resistance and volume increases compared with recent candles.
This can indicate stronger participation around the breakout.
Breakdown + Increased Volume
Price breaks support while volume expands.
This may indicate stronger selling participation.
Breakout + Very Low Volume
Price breaks an important level but trading activity remains unusually weak.
This should encourage caution because the move may lack broad participation.
Again, none of these situations guarantees what happens next.
A Practical Breakout Example
Imagine a stock has been trading between ₹480 and ₹500 for several sessions.
The ₹500 area has acted as resistance multiple times.
Price eventually reaches ₹500 again.
Then:
• Price breaks above ₹500.
• The breakout candle closes at ₹504.
• Volume is substantially higher than the recent average.
• The next candle does not immediately fall below ₹500.
This creates a potentially stronger breakout setup than simply buying because price touched ₹500.
A conservative trader might wait for a retest of ₹500.
If price returns toward ₹500, holds the area, and produces bullish price action, the retest can provide a more structured entry.
The stop-loss could be placed below a logical invalidation level rather than at an arbitrary distance.
Volume and Breakout Retest Strategy
One of the most useful ways to combine volume and price action is through breakout-retest setups.
The basic sequence is:
Resistance → Breakout → Retest → Confirmation → Entry
For a bullish setup:
1. Price approaches resistance.
2. Price breaks above resistance.
3. Volume increases during the breakout.
4. Price pulls back toward the old resistance.
5. The previous resistance begins acting as support.
6. A bullish price-action signal appears.
7. The trader considers an entry.
8. Stop-loss is placed below a logical invalidation area.
9. Target is based on structure and risk-reward rather than hope.
This approach can help traders avoid chasing extended breakout candles.
What Does a Retest Tell You?
A retest gives the market an opportunity to show whether the breakout level is being accepted.
Suppose resistance is at ₹500.
After the breakout, price rises to ₹510.
Then price falls back toward ₹500.
If price reaches ₹500 and buyers step in, producing a strong bullish reaction, the level may be showing support.
But if price falls through ₹500 with strong selling pressure, the breakout may be weakening or failing.
This is why the retest should be observed rather than assumed.
Using Volume During a Retest
Volume can provide additional context during the retest.
For example:
Strong Breakout
• Price breaks resistance.
• Volume increases significantly.
Controlled Retest
• Price pulls back.
• Volume decreases compared with the breakout.
Bullish Reaction
• Price reaches the previous resistance.
• Buyers appear.
• A bullish candle forms.
• Volume increases again.
This sequence can provide a more complete story:
Strong participation on breakout → lower activity during pullback → renewed participation near support.
It is still not a guarantee, but it can create a more logical trade setup.
How to Read High Volume With Candlesticks
High volume becomes more informative when combined with candle structure.
Large Bullish Candle + High Volume
If price moves strongly upward and volume expands, it may indicate strong participation during the upward move.
Look at where it occurs.
A large bullish candle breaking major resistance can be more significant than one appearing randomly inside a range.
Large Bearish Candle + High Volume
A strong downward candle with high volume can indicate substantial selling activity.
Again, location matters.
A bearish candle breaking important support deserves more attention than a random bearish candle.
High Volume + Long Wick
This situation requires caution.
Suppose price moves sharply upward but closes far below its high.
The long upper wick shows that price was pushed higher but sellers appeared before the close.
If this occurs at major resistance with high volume, it may indicate rejection.
Similarly, a long lower wick with high volume around support can indicate that sellers pushed price down but buyers responded strongly.
The Importance of Volume Spikes
A sudden increase in volume is commonly called a volume spike.
Volume spikes can happen because of:
• Breakouts
• Breakdowns
• Earnings announcements
• Economic news
• Market-wide events
• Large institutional activity
• Panic buying or selling
• Short covering
• Position adjustments
Therefore, a volume spike should not automatically be interpreted as bullish.
The correct question is:
What happened to price when the volume increased?
Price provides the direction and context.
Volume Climax: Be Careful With Extremely High Volume
Extremely high volume can sometimes appear near major turning points.
For example, imagine a stock falls sharply for several sessions.
Then one session produces:
• Extremely high volume
• A very large bearish candle
• A long lower wick
• A close significantly above the session low
This could indicate aggressive selling followed by buying interest.
But it does not prove that a reversal will occur.
The trader should wait for subsequent price action to confirm whether the market is actually changing structure.
Volume in an Uptrend
During an uptrend, traders can observe how volume behaves during:
• Upward impulses
• Pullbacks
• Breakouts
• New highs
A potentially healthy pattern may look like:
Strong upward movement → increased volume
followed by:
Controlled pullback → lower volume
and then:
Next upward move → renewed volume
This can suggest that selling pressure during the pullback is less aggressive than buying pressure during the impulsive move.
However, market conditions vary, so this should not be treated as a universal rule.
Volume in a Downtrend
The same concept can be applied to downtrends.
A possible bearish sequence is:
Strong decline → increased volume
followed by:
Pullback → lower volume
and then:
Continuation lower → increased selling activity
This may support the existing bearish structure.
But traders should continue monitoring price structure because trends can change.
Volume and Support
Suppose a stock has repeatedly found buyers near ₹800.
Price falls toward ₹800 again.
This time:
• Price reaches ₹800.
• A long lower wick develops.
• The candle closes above the support.
Volume increases.
• The next candle confirms the reaction.
This combination may provide more information than support alone.
The support level identifies where the reaction is occurring.
Price action shows how price reacts.
Volume shows how much activity occurred during the reaction.
Volume and Resistance
The same principle works around resistance.
Suppose resistance is near ₹1,200.
Price approaches the level with increasing volume.
Then:
• Price moves above ₹1,200.
• The candle closes strongly above resistance.
• Volume is elevated.
A later retest holds the level.
This creates a structured bullish scenario.
On the other hand, if price repeatedly moves above ₹1,200 but closes back below it with large upper wicks and heavy volume, traders should be cautious about a potential false breakout.
How to Identify a False Breakout Using Volume and Price Action
A false breakout occurs when price moves beyond an important level but fails to sustain the move.
For example:
• Resistance is at ₹500.
• Price moves to ₹507.
• Traders assume a breakout has occurred.
• Price quickly falls back below ₹500.
• The candle closes below resistance.
• Selling volume increases.
The key warning is not simply the volume.
The warning comes from the combination:
Breakout attempt + rejection + return below the level + selling pressure.
This can be much more useful than reacting to the initial breakout alone.
A Simple Entry Model for Beginners
A beginner-friendly approach is to use a confirmation-based model.
Bullish Setup
Condition 1: Market structure is bullish.
Condition 2: Price approaches an important resistance.
Condition 3: Price breaks above resistance.
Condition 4: Volume increases during the breakout.
Condition 5: Price either holds above the breakout level or successfully retests it.
Condition 6: Bullish price action appears.
Only after these conditions are satisfied should the trader consider an entry.
This reduces the temptation to enter simply because a candle is moving quickly.
Where Should the Stop-Loss Go?
A stop-loss should be based on the trade’s invalidation point, not on an arbitrary number.
For a bullish breakout-retest setup, the stop-loss may be placed below:
• The retest low
• The support area
• A meaningful swing low
The exact location depends on the chart structure and volatility.
For a bearish setup, the stop-loss may be placed above:
• The retest high
• Resistance
• A meaningful swing high
The purpose of a stop-loss is not to predict where price will stop.
It defines where the original trade idea is no longer valid.
How to Set a Target
Avoid selecting targets simply because you want a certain amount of profit.
Potential target areas can include:
• Previous swing highs
• Previous swing lows
• Major support
• Major resistance
• Range boundaries
• Measured price structures
You should also consider the relationship between potential reward and potential risk.
For example, if your planned risk is ₹500 and your realistic potential reward is ₹1,000, the trade offers a 1:2 risk-reward ratio.
But a good risk-reward ratio does not make a poor setup automatically profitable.
The setup still needs a logical market structure.
Risk Management Is More Important Than the Strategy
Even a well-designed strategy can produce losing trades.
Markets are uncertain.
Therefore, risk management should be part of the strategy from the beginning.
Consider rules such as:
• Risk only a small percentage of trading capital on one trade.
• Always define the stop-loss before entering.
• Avoid increasing position size after a loss.
• Avoid revenge trading.
• Do not move a stop-loss farther away just to avoid taking a loss.
• Do not risk money you cannot afford to lose.
• Keep a trading journal.
For beginners, consistency in risk management is often more important than finding another indicator.
Position Sizing Example
Suppose:
Trading capital = ₹1,00,000
You decide that your maximum risk per trade is 1%.
Maximum planned loss:
₹1,00,000 × 1% = ₹1,000
Now suppose:
Entry = ₹500
Stop-loss = ₹490
Risk per share:
₹500 − ₹490 = ₹10
Maximum position size based on the ₹1,000 risk limit:
₹1,000 ÷ ₹10 = 100 shares
This is only a simplified example. Actual position sizing also needs to consider lot sizes, brokerage, taxes, slippage, liquidity, and the specific instrument being traded.
A Complete Example
Let’s put everything together.
Imagine a stock has been moving sideways between ₹900 and ₹950.
The ₹950 area has acted as resistance several times.
Stage 1: Setup
→ Price approaches ₹950 again.
The market has not yet broken resistance.
Stage 2: Breakout
→ Price moves above ₹950 and closes at ₹958.
Volume is significantly higher than recent candles.
This provides initial breakout confirmation.
Stage 3: Retest
Price pulls back toward ₹950.
Instead of immediately falling through the level, it stabilizes around the previous resistance.
Stage 4: Confirmation
→ A bullish candle forms around ₹950 with signs of buying interest.
Stage 5: Entry
→ A trader may consider an entry after confirmation rather than buying the initial breakout blindly.
Stage 6: Stop-Loss
→ The stop-loss is positioned below a logical invalidation point, such as the retest structure.
Stage 7: Target
The target is selected using nearby resistance, swing structure, or another objective method.
The important part is that the trade is based on a sequence of evidence, not one candle or one volume spike.
When This Strategy Works Best
Volume and price action can be particularly useful during:
1. Breakouts
→ Volume can help evaluate whether participation increased as price moved through an important level.
2. Breakout Retests
→ Price action can show whether the old resistance or support is being respected.
3. Trend Continuation
→ Volume can provide additional context when price resumes the existing trend after a pullback.
4. Major Support and Resistance
→ Large changes in volume around important levels can provide useful information about market participation.
5. Consolidation Breakouts
→When price remains trapped in a range, a breakout accompanied by meaningful participation may deserve closer attention.
When You Should Be Careful
The strategy is not equally useful in every market condition.
Be cautious during:
• Extremely low-liquidity periods
• Random sideways price action
• Major unexpected news
• Very wide spreads
• Extremely volatile sessions
• Assets with unreliable volume data
• Unusual opening moves
• Markets where volume data is difficult to interpret
News-driven markets can move rapidly even when a technical setup looks perfect.
Common Mistakes Beginners Make
Mistake 1: Treating High Volume as a Buy Signal
→ High volume does not automatically mean buying.
It simply tells you that trading activity increased.
Always study what price did.
Mistake 2: Ignoring Market Structure
→ A volume spike is not enough.
You should know whether the market is trending, ranging, breaking out, or reversing.
Mistake 3: Chasing Breakouts
→ A large breakout candle can create fear of missing out.
Beginners often buy after price has already moved significantly.
Waiting for a retest or additional confirmation can create a more structured decision.
Mistake 4: Using Too Many Indicators
→ Adding RSI, MACD, multiple moving averages, several oscillators, and multiple volume indicators can make a chart difficult to understand.
Price action and volume can already provide substantial information.
The goal is not to make the chart complicated.
Mistake 5: Moving the Stop-Loss
→ A trader enters a position and price moves against them.
Instead of accepting the predefined loss, they move the stop farther away.
This can turn a controlled loss into a much larger one.
Mistake 6: Assuming Every Breakout Will Continue
→ Markets produce false breakouts.
A breakout should be treated as a hypothesis that needs confirmation, not as a guarantee.
Mistake 7: Ignoring Risk-to-Reward
→ Even a good setup can fail.
If the potential reward is small compared with the risk, the trade may not be attractive.
Volume and Price Action vs Indicators
Indicators are mathematical calculations based on price, volume, or both.
Examples include:
• RSI
• MACD
• Moving averages
• Bollinger Bands
• VWAP
Price action focuses more directly on the behavior of price.
Volume provides information about market activity.
There is nothing wrong with using indicators, but beginners should first learn how to interpret the chart itself.
A simple chart that you understand is usually more useful than a complicated chart that you cannot interpret consistently.
Can Volume and Price Action Be Used for Intraday Trading?
Yes, traders can apply these concepts to intraday charts.
For example, they can monitor:
• Previous day’s high
• Previous day’s low
• Intraday support and resistance
• Opening range
• Breakouts
• Retests
• Volume expansion
• Candlestick reactions
However, intraday markets can be noisy.
A setup that looks perfect on a chart can still fail because of sudden news, liquidity changes, or market-wide movements.
For options traders, the underlying asset’s price and volume should receive particular attention rather than relying only on the option premium chart.
Can It Be Used for Swing Trading?
Yes.
The same framework can be applied to higher timeframes.
For example:
Daily chart → Major level → Breakout → Volume expansion → Retest → Confirmation
Swing traders may use daily or weekly charts to identify important structures and then use smaller timeframes for more precise entries if appropriate.
The best timeframe depends on the trader’s strategy, holding period, liquidity, and risk tolerance.
A Simple Volume and Price Action Trading Checklist
Before entering a trade, ask:
• [ ] What is the current market structure?
• [ ] Is the market trending or ranging?
• [ ] Where are the important support and resistance levels?
• [ ] What price-action setup am I seeing?
• [ ] Is volume supporting the move?
• [ ] Where is my entry?
• [ ] Where is the trade idea invalidated?
• [ ] Where is my stop-loss?
• [ ] What is my realistic target?
• [ ] What is my risk-reward ratio?
• [ ] How much capital am I risking?
• [ ] Is there major news that could affect the trade?
• [ ] Am I entering because of a setup or because of FOMO?
If you cannot clearly answer these questions, there may be no need to take the trade.
How to Practice This Strategy Without Risking Real Money
Beginners should consider practicing before risking actual capital.
Step 1: Choose One Market
→ Do not jump between dozens of stocks.
Choose a small number of liquid instruments to study.
Step 2: Choose One Timeframe
→ Start with a timeframe that gives you enough information without creating excessive noise.
Step 3: Mark Historical Levels
→ Find previous support and resistance levels.
Step 4: Study Breakouts
→ Look at historical examples where price broke those levels.
Step 5: Compare Volume
→ Observe whether volume expanded or decreased around the breakout.
Step 6: Study the Retest
→ Check what happened after the breakout.
Step 7: Record the Result
Create a simple trading journal.
Record:
• Market
• Date
• Setup
• Entry
• Stop-loss
• Target
• Volume behavior
• Result
• Mistake, if any
After collecting enough examples, you can begin evaluating whether the rules actually work for your chosen market and timeframe.
How to Improve the Strategy Over Time
Do not immediately change your strategy after a few losing trades.
Instead, collect data.
For example, after 50 or 100 properly recorded setups, analyze:
• Win rate
• Average reward-to-risk
• Average loss
• Average profit
• Maximum losing streak
• Best market conditions
• Worst market conditions
• Breakout success rate
• Retest success rate
This turns trading from random decision-making into a process that can be tested and improved.
Volume and Price Action Trading Strategy
Final Thoughts
The Volume and Price Action Trading Strategy is not about finding a magical volume setting or predicting every market movement.
Its real value comes from combining different pieces of evidence.
Price action tells you what price is doing.
Volume tells you how much trading activity is occurring.
When the two are studied together around important market levels, traders can make more structured decisions.
A strong approach is to focus on:
Market Structure → Key Level → Price Action → Volume → Confirmation → Risk Management
Most importantly, remember that no setup works every time.
Successful trading is not about winning every trade. It is about controlling risk, following a repeatable process, and learning from a large sample of trades.
For beginners, the best place to start is not with bigger positions or more indicators. Start with understanding price, volume, market structure, and risk management.
Volume and Price Action Trading Strategy
Frequently Asked Questions
Is volume and price action trading good for beginners?
→ It can be a useful framework for beginners because it focuses on relatively simple concepts: price movement, market structure, important levels, and trading activity. Beginners should practice it on historical charts or a demo environment before risking real money.
Does high volume mean the price will go up?
→ No. High volume only indicates increased trading activity. Price can rise or fall on high volume, so the candle structure and location of the volume spike are important.
What is the best volume indicator for beginners?
→ The standard volume histogram is often enough to start. Beginners do not necessarily need several volume indicators.
Can this strategy be used for Nifty and Bank Nifty?
→ The concepts can be applied to index charts, but traders should understand how the underlying index and its derivatives behave. Options can have additional factors such as time decay, implied volatility, and liquidity.
Can volume predict the stock market?
→ Volume cannot reliably predict the future by itself. It provides information about participation and activity that can be combined with price structure to form a trading hypothesis.
Is price action better than indicators?
→ Neither is automatically better. Price action provides direct information about market movement, while indicators can help organize or quantify certain aspects of that movement. The most important factor is whether the method is understood, tested, and used consistently.
How much volume is considered strong?
→ There is no universal number. Traders commonly compare current volume with recent volume or a volume average. What qualifies as strong depends on the asset, timeframe, and normal trading activity.
Volume and Price Action Trading Strategy
Pingback: How to Choose Stocks for Intraday Trading in India - jdtradingzone
Pingback: Opening Range Breakout Strategy: A Practical Guide for Intraday Traders in India - jdtradingzone