
Hello guys today we will learn together about How to Confirm a Breakout Before Taking a Trade , which signals can improve confirmation, common mistakes beginners make, and how to build a simple breakout confirmation process.
Welcome to JD Trading Zone
Important: Breakout confirmation cannot guarantee a profitable trade. Markets can reverse unexpectedly, so proper risk management is always necessary.
A breakout can look exciting on a price chart. A stock moves above resistance, a candle closes strongly, and it may feel like the perfect time to enter.
But there is a problem: not every breakout is a real breakout.
Many traders enter immediately when price crosses a resistance or support level, only to see the market reverse shortly afterward. This is commonly known as a false breakout or fakeout.
Learning how to confirm a breakout before entering a trade can help traders avoid many low-quality setups and make more disciplined trading decisions.
Also check:- (How to Identify Market Trend Before Taking a Trade) (Rules of Option Trading for Beginners) (Best Free Websites for Stock Market Analysis) (Position Sizing Explained) (Trading Journal: Why Every Trader Needs One)
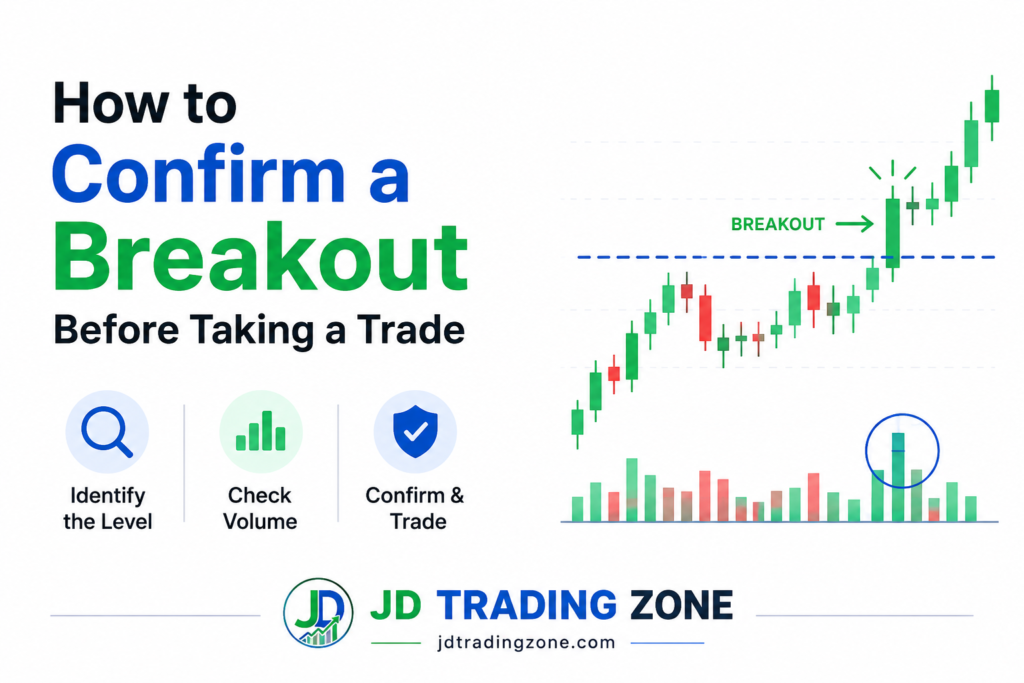
Confirming a Breakout Before Taking a Trade
What Is a Breakout?
A breakout occurs when the price moves beyond an important level of support, resistance, a trading range, trendline, or chart pattern.
For example, suppose a stock repeatedly struggles to move above ₹500. Traders may consider ₹500 an important resistance level.
If the price eventually moves above ₹500, that could be a bullish breakout.
Similarly, if a stock repeatedly finds support around ₹450 and then falls below ₹450, it could be considered a bearish breakdown.
However, simply crossing a level does not automatically mean the breakout is reliable.
The important question is:
Did price actually break the level, or did it only temporarily move beyond it?
That is why confirmation matters.
Why Do False Breakouts Happen?
False breakouts are common because markets are influenced by buyers, sellers, liquidity, news, sentiment, and changing expectations.
A price may temporarily move above resistance because buyers become aggressive. But if there is not enough sustained buying pressure, sellers may enter and push the price back below the resistance.
Some common reasons for false breakouts include:
• Low trading volume
• Weak buying or selling pressure
• Poorly defined support or resistance
• Sudden market-wide reversals
• News-driven price movements
• Breakouts occurring during low-liquidity periods
• Traders entering too early
• Price moving only slightly beyond the level before reversing
Therefore, traders should avoid treating every level-crossing as a confirmed breakout.
7 Ways to Confirm a Breakout Before Taking a Trade
There is no single confirmation signal that works in every market condition. Instead, traders can combine multiple pieces of evidence.
Here are seven useful methods.
1. Wait for the Candle to Close Beyond the Level
One of the simplest ways to avoid premature entries is to wait for a candle to close beyond the breakout level.
Suppose resistance is at ₹500.
Price moves to ₹506 but then falls back to ₹499 before the candle closes.
This is not the same as a candle closing strongly above ₹500.
A stronger breakout may look like:
Resistance → ₹500
Candle opens → ₹498
Candle closes → ₹507
The close above resistance provides more information than a temporary intraday move above it.
Why Candle Close Matters
During a candle’s formation, price can move in both directions.
Waiting for the close allows traders to see where the market actually finished that period.
However, waiting for a candle close does not eliminate false breakouts. It simply provides an additional confirmation layer.
2. Check Trading Volume
Volume can provide useful information about participation during a breakout.
A breakout accompanied by noticeably higher volume may indicate that more market participants are involved in the move.
For example:
Before breakout:
Average volume
During breakout:
Significant increase in volume
This can be more convincing than a breakout occurring on unusually low volume.
Example
Imagine a stock has been trading between ₹480 and ₹500 for several days.
It finally moves above ₹500.
→ Scenario A
Price breaks ₹500 with low volume and quickly returns below the level.
This may be a warning sign.
→ Scenario B
Price breaks ₹500 with strong volume and remains above the level.
This provides stronger evidence that market participation is supporting the move.
However, volume should not be used alone. High volume can also occur during sharp reversals.
3. Look for a Retest of the Breakout Level
A retest can be one of the most useful confirmation techniques for breakout traders.
Suppose a stock breaks above resistance at ₹500.
Instead of buying immediately, a trader waits.
Price moves to ₹515 and then pulls back toward ₹500.
If ₹500 now acts as support and buyers step in, the old resistance may have turned into new support.
This creates a possible breakout-and-retest setup.
Basic Structure
Resistance
₹500
↓
Price breaks above ₹500
↓
Price moves higher
↓
Price returns toward ₹500
↓
₹500 holds as support
↓
Price attempts to move higher again
This type of confirmation can offer a more structured entry than chasing the initial breakout.
But remember that not every breakout will retest the level. Sometimes price continues moving without giving a retest.
4. Check the Higher Timeframe
A breakout that looks strong on a very small timeframe may look insignificant on a larger timeframe.
For example, a breakout on a 5-minute chart may be occurring directly below major resistance on the daily chart.
This can make the trade less attractive.
Before taking a breakout trade, consider checking a higher timeframe.
For example:
• 5-minute chart → intraday entry
• 15-minute chart → short-term structure
• 1-hour chart → broader intraday trend
• Daily chart → major support and resistance
You don’t necessarily need to use many timeframes.
The goal is simply to understand the larger market structure.
Example
If a stock breaks above ₹500 on a 15-minute chart but faces major daily resistance at ₹505, the available upside may be limited.
A trader who checks only the 15-minute chart might miss this important information.
5. Identify the Overall Market Trend
Breakouts generally become more meaningful when they agree with the broader market direction.
For example, a bullish breakout in a strong uptrend may have better conditions than a bullish breakout occurring against a powerful downtrend.
Consider this simple framework:
→ Bullish Setup
• Higher highs and higher lows
• Price above important moving averages
• Resistance breakout
• Strong participation
• Positive market structure
→ Bearish Setup
• Lower highs and lower lows
• Price below important moving averages
• Support breakdown
• Strong selling pressure
• Weak market structure
This does not mean traders should blindly buy in an uptrend or sell in a downtrend.
It simply means market context matters.
6. Watch the Strength of the Breakout Candle
Not all breakout candles are equal.
A strong breakout candle generally shows clear movement beyond the level rather than a tiny price violation followed by rejection.
For example, if resistance is ₹500 and price briefly reaches ₹501 before closing at ₹499, the breakout has not demonstrated much strength.
On the other hand, a candle that moves decisively above ₹500 and closes near its high may show stronger buying pressure.
Still, traders should avoid judging candle strength in isolation.
A large candle can sometimes be followed by a sharp reversal.
7. Check for Rejection After the Breakout
Price behavior around the breakout level can reveal whether buyers or sellers are gaining control.
Suppose price moves above resistance but forms a long upper wick and closes back near or below the resistance level.
That can indicate selling pressure.
For a bearish breakdown, the opposite can happen.
Price moves below support but quickly recovers and closes above the level.
This may indicate that sellers failed to maintain control.
Simple Rule
Breakout + strong acceptance beyond the level = potentially stronger setup
Breakout + immediate rejection back through the level = warning sign
A Simple Breakout Confirmation Strategy for Beginners
Beginners do not need ten indicators to confirm every breakout.
A simple process can be more useful.
Consider using these five questions:
Step 1: Is the Level Important?
→ Ask:
• Has price tested the level multiple times?
• Is it clearly visible on the chart?
• Is it a meaningful support or resistance zone?
If the level is random or poorly defined, the breakout may not be meaningful.
Step 2: Did the Candle Close Beyond the Level?
→ Do not automatically treat an intraday price spike as confirmation.
Wait for the candle to close according to your trading timeframe.
Step 3: Is Volume Supporting the Move?
→ Compare breakout volume with recent average activity.
Higher participation can provide additional confirmation.
Step 4: Does the Larger Trend Support the Trade?
→ Check whether the breakout agrees with the broader market structure.
Step 5: Where Is the Stop-Loss?
→ Before entering, know exactly where the trade idea becomes invalid.
If you cannot define a logical stop-loss, the setup may not be ready.
Breakout Example
Imagine a stock has repeatedly struggled near ₹1,000.
For several sessions, price remains below this level.
Then:
Resistance: ₹1,000
Breakout price: ₹1,015
Volume: Higher than recent average
Candle close: Above ₹1,000
Market trend: Bullish
The stock later pulls back toward ₹1,000.
Instead of immediately falling below the level, price finds buying interest around ₹1,000 and starts moving higher.
This gives the trader several pieces of evidence:
• A clearly defined resistance level
• A candle close above resistance
• Increased participation
• A retest
• Support holding after the retest
• A broader bullish structure
No single signal guarantees success.
But several independent confirmations can create a more logical trading setup.
Breakout Confirmation vs. Breakout Prediction
There is an important difference between predicting a breakout and confirming one.
Prediction
A trader sees resistance at ₹500 and buys at ₹495 because they expect price to break ₹500.
The trader is predicting the breakout.
Confirmation
The trader waits for price to break ₹500, observes the market reaction, and enters only after predefined confirmation conditions are met.
The second approach may result in a later entry.
However, the goal of confirmation is not to enter at the absolute lowest price.
The goal is to improve the quality of the trade decision.
Should You Always Wait for a Retest?
No.
Waiting for a retest is one possible confirmation method, but it is not mandatory for every trading strategy.
Some breakouts move strongly without ever returning to the breakout level.
If a trader always waits for a retest, they may miss some valid moves.
On the other hand, entering every breakout immediately can expose the trader to more false breakouts.
Therefore, traders should decide their confirmation rules before entering a trade.
Consistency is more important than trying to catch every move.
Common Breakout Trading Mistakes
Mistake 1: Entering as Soon as Price Crosses the Level
→ A temporary price move above resistance is not necessarily a confirmed breakout.
Better approach: Define what confirmation means before entering.
Mistake 2: Ignoring Volume
→ A breakout with weak participation may deserve additional caution.
Better approach: Compare breakout volume with recent trading activity.
Mistake 3: Chasing a Large Candle
→ After a large breakout candle, traders sometimes enter because they fear missing the move.
The market can then pull back sharply.
Better approach: Avoid making decisions purely from FOMO.
Mistake 4: Ignoring Higher-Timeframe Resistance
→ A short-term breakout can run directly into major resistance.
Better approach: Check the larger chart structure before entering.
Mistake 5: Using Too Many Indicators
→ Adding RSI, MACD, multiple moving averages, Bollinger Bands, stochastic indicators, and several other tools does not automatically create better confirmation.
Too many indicators can create confusion.
Better approach: Use a small number of tools that answer different questions.
For example:
• Price action → Is the level breaking?
• Volume → Is participation supporting the move?
• Higher timeframe → What is the broader structure?
• Risk management → Where is the setup invalid?
Mistake 6: Moving the Stop-Loss After Entry
→ A breakout trade can fail.
Moving the stop-loss farther away simply because price is moving against you can turn a planned small loss into a much larger one.
Better approach: Define your invalidation level before entering.
How to Set a Stop-Loss on a Breakout Trade
A stop-loss should be based on the structure of the trade rather than an arbitrary number.
For a bullish breakout, possible invalidation areas may include:
• Below the breakout level
• Below the retest low
• Below a recent swing low
For a bearish breakdown, possible areas may include:
• Above the breakdown level
• Above the retest high
• Above a recent swing high
The exact placement depends on the strategy, timeframe, volatility, and instrument.
Avoid placing stops so close that normal market fluctuations repeatedly trigger them.
Risk-Reward Matters Too
Even a correctly confirmed breakout can fail.
Therefore, traders should consider the potential reward relative to the amount they are risking.
For example, if a trade risks ₹500 and the planned potential reward is ₹1,000, the risk-to-reward ratio is 1:2.
This does not mean every trade must have exactly a 1:2 ratio.
The important point is that traders should understand the relationship between potential loss and potential profit before entering.
A high-quality setup with poor risk management can still produce poor results.
Breakout Confirmation Using VWAP
For intraday traders, VWAP can sometimes provide additional market context.
VWAP stands for Volume Weighted Average Price.
If a bullish breakout occurs while price is also maintaining a position above VWAP, some traders may interpret this as additional evidence of intraday buying strength.
Similarly, during a bearish setup, price remaining below VWAP can support the bearish market context.
However, VWAP should not be treated as a guarantee.
A breakout can fail even when price is above VWAP.
The important principle is to use VWAP as context, not as a standalone entry signal.
Breakout Confirmation Using RSI or MACD
Momentum indicators such as RSI and MACD can also provide supporting information.
For example, a bullish breakout may be more interesting when momentum is also improving.
But traders should be careful about using indicators as automatic confirmation.
Indicators are calculated from price data and can sometimes react after the price has already moved.
Therefore:
Price structure should remain the foundation.
Indicators can provide additional context rather than replacing price action.
A Practical Breakout Checklist
Before taking a breakout trade, ask yourself:
• [ ] Is the support or resistance level clearly defined?
• [ ] Has the level been respected previously?
• [ ] Has price actually moved beyond the level?
• [ ] Has the candle closed beyond the level?
• [ ] Is volume supporting the breakout?
• [ ] Does the higher timeframe support the direction?
• [ ] Is the overall market structure favorable?
• [ ] Is there evidence of rejection or acceptance?
• [ ] Is a retest available?
• [ ] Where is the logical stop-loss?
• [ ] What is the potential risk-to-reward?
• [ ] Am I entering because of a setup or because of FOMO?
If several answers are unclear, there may be no need to rush into the trade.
Sometimes not taking a trade is also a trading decision.
When Should You Avoid a Breakout?
A breakout may deserve extra caution when:
• Price barely moves beyond the level
• The candle closes back inside the range
• Volume is unusually weak
• There is strong rejection
• A major higher-timeframe level is nearby
• The overall market is moving strongly in the opposite direction
• The breakout occurs during unusual news volatility
• The stop-loss would be excessively large
• The trade offers very little potential reward
• You are entering only because you fear missing the move
Avoiding weak setups can be just as important as finding good ones.
Breakout Trading Is About Probability, Not Certainty
One of the biggest lessons beginners should understand is that confirmation does not make a breakout certain.
There is no indicator, candlestick pattern, volume signal, or strategy that can predict every market move correctly.
A confirmed breakout can still fail because of:
• Unexpected news
• Market-wide reversals
• Sudden liquidity changes
• Profit booking
• Institutional selling
• Changes in market sentiment
The purpose of confirmation is to gather more evidence before risking capital.
It is not to find a signal that guarantees profit.
Final Thoughts
Confirming a breakout before entering a trade can help beginners avoid many impulsive decisions.
Instead of buying immediately when price crosses resistance, look at the candle close, volume, retest, market structure, higher timeframe, and risk management.
A simple process can be:
Important Level → Breakout → Candle Close → Volume/Market Context → Retest or Additional Confirmation → Risk Check → Entry
You do not need to use every possible indicator.
Focus on understanding price behavior and developing a repeatable process. Most importantly, remember that a breakout is only a trading opportunity—not a guarantee of profit.
Good trading is not about catching every breakout.
It is about waiting for setups that fit your rules and managing risk when they do not work.
How to Confirm a Breakout Before Taking a Trade
Frequently Asked Questions
What is the best confirmation for a breakout?
→ There is no single best confirmation. A candle close beyond an important level, supportive volume, favorable market structure, and a successful retest can together provide stronger evidence.
Is volume necessary for breakout confirmation?
→ Volume is not mandatory, but it can provide useful information about market participation. Traders should compare breakout volume with recent activity rather than relying on a single volume reading.
Should I buy immediately after a breakout?
→ Not necessarily. Depending on your strategy, you can wait for a candle close, retest, or other predefined confirmation. Entering immediately can increase exposure to false breakouts.
What is a false breakout?
→ A false breakout occurs when price moves beyond a support or resistance level but fails to sustain the move and returns back through the level.
Can indicators confirm a breakout?
→ Indicators such as VWAP, RSI, and MACD can provide additional context, but they should not be treated as guarantees. Price structure and risk management should remain important parts of the decision.
Is breakout trading suitable for beginners?
→ Beginners can learn breakout trading, but they should first understand support, resistance, candlesticks, volume, market structure, position sizing, and stop-loss management. Start with paper trading or a simulated environment if you are still learning.
How to Confirm a Breakout Before Taking a Trade
Risk Disclaimer
This article is for educational and informational purposes only and should not be considered financial, investment, or trading advice. Stock and derivatives trading involve substantial risk, and losses can exceed expectations. Always conduct your own research and understand the risks before making financial decisions.
Published by JD Trading Zone
Современный дом трудно представить без пластиковых окон, дарящих тепло и тишину. Ищете пластиковые окна 777? Компания okno-777.ru предлагает изготовление и установку качественных окон ПВХ под ключ по доступным ценам. Специалисты компании бесплатно проведут замер, оперативно смонтируют конструкции и аккуратно отделают откосы. Заказчик получает гарантию, надежную фурнитуру и энергосберегающие стеклопакеты, которые прослужат долгие десятилетия.
Pingback: Breakout Retest Strategy Explained - jdtradingzone.com
Pingback: Volume and Price Action Trading Strategy - jdtradingzone