
How to identify market trend before taking a trade using simple methods. Hmm I think this is interesting topic that beginners can understand and apply.
Welcome to JD Trading Zone
Important: Trend analysis is not a prediction tool. Markets can change direction unexpectedly, so always combine trend analysis with proper risk management.
Introduction
One of the biggest mistakes beginners make in trading is entering a trade without first understanding the market trend.
A trader may find a good-looking candlestick pattern, a moving-average crossover, or an indicator signal, but if that signal goes against the broader market direction, the trade can fail quickly.
Understanding the trend does not guarantee a profitable trade. Instead, it helps you make decisions with better context and avoid taking random positions.
Also check:- (Rules of Option Trading for Beginners) (Best Free Websites for Stock Market Analysis) (Position Sizing Explained) (Trading Journal: Why Every Trader Needs One) (How to Backtest a Trading Strategy)
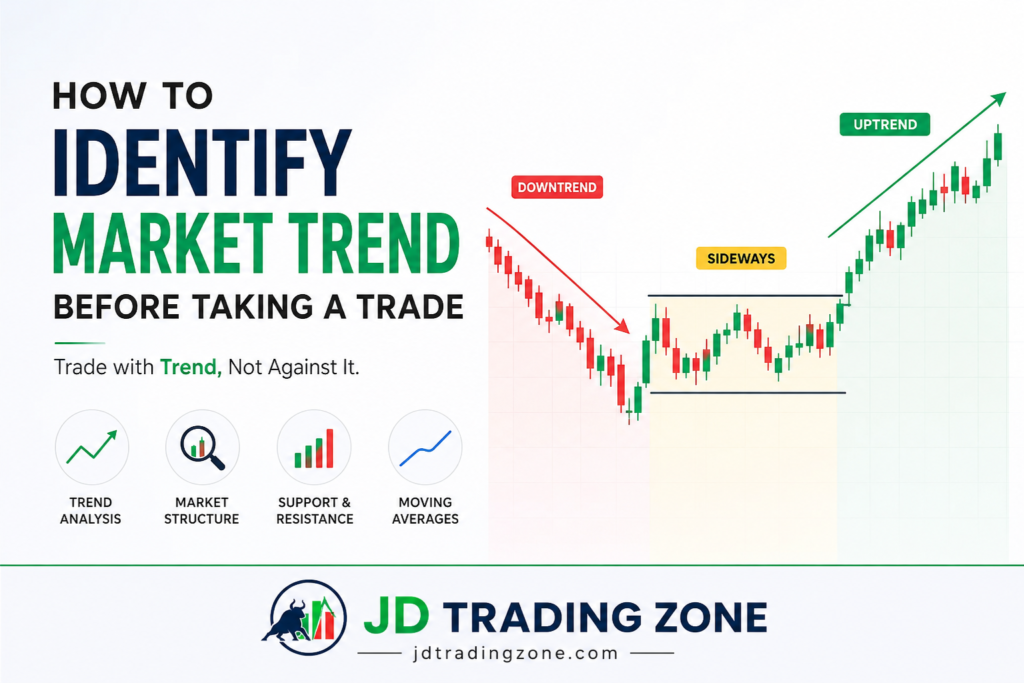
How to Identify Market Trend Before Taking a Trade
What Is a Market Trend?
A market trend is the general direction in which the price is moving over a period of time.
There are three basic types of market conditions:
1. Uptrend
An uptrend occurs when price generally forms:
Higher Highs (HH) + Higher Lows (HL)
For example:
• Price rises and creates a new high.
• It pulls back but stays above the previous important low.
• Price rises again and creates another high.
This indicates that buyers are generally stronger than sellers.
2. Downtrend
A downtrend occurs when price generally forms:
Lower Highs (LH) + Lower Lows (LL)
For example:
• Price falls and creates a new low.
• It moves upward but fails to break the previous important high.
• Price falls again and creates another low.
This suggests that sellers have greater control.
3. Sideways or Range-Bound Market
Sometimes the market does not create a clear sequence of higher highs or lower lows.
Instead, price moves between a support and resistance area.
This is called a sideways market or range-bound market.
Many beginners lose money in sideways conditions because they use trend-following strategies when there is no clear trend.
Why Should You Identify the Trend Before Trading?
Trend identification gives you important market context.
It can help you:
• Avoid trading against strong momentum.
• Choose more suitable entry setups.
• Understand whether buyers or sellers are in control.
• Filter low-quality trading signals.
• Select appropriate trading strategies.
• Set more logical stop-loss levels.
• Avoid taking trades simply because an indicator gives a signal.
However, identifying a trend does not mean you should enter every trade in the same direction.
A strong uptrend can still experience sharp corrections, and a downtrend can suddenly reverse.
Step 1: Start With the Higher Timeframe
One of the simplest ways to improve trend analysis is to start with a higher timeframe.
For example, if you plan to take an intraday trade on a 5-minute chart, first check a higher timeframe such as the 15-minute, 1-hour, or daily chart depending on your trading style.
The purpose is to understand the broader market structure before looking for an entry.
Example
Suppose you are planning to buy an index based on a 5-minute setup.
If the higher timeframe shows:
• Higher highs
• Higher lows
Strong upward momentum
then buying opportunities may deserve more attention.
But if the higher timeframe is strongly bearish, blindly buying every bullish signal on the 5-minute chart can be risky.
Higher timeframe = context
Lower timeframe = entry
This simple distinction can make your analysis more structured.
Step 2: Learn to Read Market Structure
Market structure is one of the most useful ways to identify a trend without depending entirely on indicators.
Look at important swing highs and swing lows.
→ Bullish Market Structure
A bullish structure generally looks like:
Higher High → Higher Low → Higher High → Higher Low
This shows that buyers are maintaining control.
→ Bearish Market Structure
A bearish structure generally looks like:
Lower Low → Lower High → Lower Low → Lower High
This shows that sellers are maintaining control.
→ What About a Trend Break?
Suppose an uptrend has been making higher highs and higher lows.
Then price falls below an important previous higher low.
That does not automatically mean a complete trend reversal.
Instead, it tells you that the previous bullish structure has weakened and deserves closer observation.
Avoid labeling every small price movement as a trend reversal.
Step 3: Identify Support and Resistance
Support and resistance can provide important context for trend analysis.
→ Support
Support is an area where buying interest has previously appeared and prevented or slowed a decline.
→ Resistance
Resistance is an area where selling pressure has previously appeared and prevented or slowed an advance.
In an uptrend, you may see price:
Break resistance → Pull back → Hold support → Continue higher
In a downtrend, you may see:
Break support → Pull back → Face resistance → Continue lower
These areas can help you understand whether a trend is continuing or losing strength.
Remember that support and resistance are usually zones, not exact prices.
Step 4: Use Moving Averages as a Trend Filter
Moving averages can help simplify trend identification.
Popular choices include:
• 20 EMA
• 50 EMA
• 100 EMA
• 200 EMA
For beginners, the 50 EMA and 200 EMA can provide useful broader trend context.
Price Above the Moving Average
If price is consistently trading above a rising moving average, the market may have bullish characteristics.
Price Below the Moving Average
If price is consistently trading below a falling moving average, the market may have bearish characteristics.
But do not use one moving-average crossover as proof that a trend will continue.
Moving averages are lagging indicators because they are calculated from historical prices.
They work better as part of a broader analysis rather than as a standalone decision-making system.
Step 5: Use VWAP for Intraday Trend Context
For intraday traders, VWAP (Volume Weighted Average Price) can be useful.
VWAP shows the average price traded during the session while taking volume into account.
A simple interpretation is:
→ Price Above VWAP
When price is holding above VWAP and the VWAP is rising, intraday conditions may favor buyers.
→ Price Below VWAP
When price is holding below VWAP and the VWAP is falling, intraday conditions may favor sellers.
→ Price Constantly Crossing VWAP
If price repeatedly moves above and below VWAP, the market may be choppy.
In that situation, forcing trades can be dangerous.
VWAP should be treated as a context tool, not a guaranteed buy or sell signal.
Step 6: Check Volume
Price tells you what the market is doing.
Volume can provide additional information about participation behind that movement.
For example, if price breaks above an important resistance area with noticeably higher volume, the breakout may deserve more attention than a breakout occurring on very weak volume.
Similarly, a decline accompanied by strong participation may indicate meaningful selling pressure.
However, volume should not be interpreted in isolation.
A high-volume candle can occur because of news, institutional activity, volatility, or other factors.
Always consider the location of the price and the broader market structure.
Step 7: Watch Momentum
Momentum indicators can help you understand whether price movement has strength behind it.
Common indicators include:
• RSI
• MACD
• Stochastic Oscillator
For example, traders sometimes use MACD to evaluate momentum and potential changes in direction.
RSI can also help identify whether momentum is strong, weak, or stretched.
But avoid a common beginner mistake:
Do not assume an overbought market must immediately fall or an oversold market must immediately rise.
A strong market can remain overbought or oversold for an extended period.
Indicators should support your analysis rather than replace it.
Step 8: Compare Price With the Trend
After checking the higher timeframe, market structure, support and resistance, and indicators, ask a simple question:
Is my planned trade aligned with the current market direction?
For example:
→ Potential Bullish Setup
• Higher timeframe is bullish.
• Market is making higher highs and higher lows.
• Price is above an important moving average.
• Price is holding above VWAP during the session.
• A pullback reaches a meaningful support area.
• Buyers show signs of returning.
• This creates a more logical bullish context.
→ Potential Bearish Setup
• Higher timeframe is bearish.
• Market is making lower highs and lower lows.
• Price is below an important moving average.
• Price remains below VWAP.
• A pullback reaches resistance.
• Sellers begin showing strength.
Again, this does not guarantee success. It simply creates a more structured setup.
Step 9: Look for Pullbacks Instead of Chasing Price
One common beginner mistake is entering after a large candle because they are afraid of missing the move.
This is known as FOMO — Fear of Missing Out.
Suppose an index suddenly rises several percent or makes a very large bullish candle.
Instead of immediately buying, consider waiting for the market to show whether it can hold the new price area.
In a healthy uptrend, a pullback toward previous support, VWAP, a moving average, or another important technical area may provide a more structured opportunity.
The same concept can apply to downtrends.
Do not chase a move simply because price is moving quickly.
Step 10: Check Whether the Market Is Trending or Ranging
Before taking a trade, determine whether the market is actually trending.
→ Signs of a Trending Market
• Clear higher highs and higher lows, or lower highs and lower lows.
• Directional price movement.
• Moving averages have a noticeable slope.
• Pullbacks tend to respect important levels.
• Breakouts have follow-through.
→ Signs of a Range
• Price repeatedly moves between support and resistance.
• Swing highs and lows are unclear.
• Moving averages become flat.
• Price frequently crosses VWAP.
• Breakouts fail regularly.
• Candles show frequent reversals.
Different market conditions require different strategies.
A trend-following strategy may perform well during a strong directional move but produce repeated false signals inside a tight range.
A Simple Trend Identification Process for Beginners
You do not need ten indicators to determine the market direction.
Try this simple process:
Step 1 — Check the higher timeframe
Ask:
Is the broader market bullish, bearish, or sideways?
Step 2 — Check market structure
Look for:
HH + HL = bullish
LH + LL = bearish
Step 3 — Mark important levels
Identify:
• Support
• Resistance
• Previous day high
• Previous day low
• Major swing points
Step 4 — Check VWAP or a moving average
Use these tools to confirm whether current price behavior agrees with the broader trend.
Step 5 — Check momentum and volume
Ask whether there is meaningful participation behind the move.
Step 6 — Wait for a setup
Do not enter simply because the market is bullish or bearish.
Wait for your specific entry criteria.
Step 7 — Define risk before entering
Know:
• Entry
• Stop-loss
• Target
• Position size
• Maximum acceptable loss
Only then should you consider taking the trade.
Example: Identifying an Intraday Uptrend
Imagine you are analyzing an index for an intraday trade.
You first check the 1-hour chart and notice that the market has been making higher highs and higher lows.
You then move to the 15-minute chart and see that price remains above an important moving average.
After the market opens, price moves above VWAP and holds there.
Later, price pulls back toward a previous support area.
Instead of buying immediately, you wait for evidence that buyers are defending the level.
If your trading strategy gives a valid entry signal, you can then evaluate the trade.
Notice the sequence:
Higher timeframe → Market structure → Key levels → VWAP/MA → Pullback → Entry signal → Risk management
This is much more structured than entering simply because a green candle appeared.
Example: When You Should Avoid a Trade
Imagine the market has been moving sideways for several hours.
You notice:
• Price repeatedly crosses VWAP.
• Moving averages are flat.
• Support and resistance are close together.
• Breakouts keep failing.
• There is no clear sequence of higher highs or lower lows.
Even if an indicator produces a buy signal, the overall market condition may not be suitable for a trend-following trade.
Sometimes the best trading decision is not to trade.
Cash is also a position.
Common Mistakes Beginners Make
1. Using Only One Indicator
→ An indicator cannot completely describe market conditions.
Combine price structure with key levels and appropriate tools.
2. Ignoring Higher Timeframes
→ A bullish 5-minute signal may occur inside a larger bearish trend.
Always understand the broader context.
3. Treating Every Breakout as a Trend
→ Some breakouts are false breakouts.
Wait for confirmation and follow-through according to your trading plan.
4. Chasing Large Candles
→ A large candle does not automatically mean the next candle will continue in the same direction.
Avoid emotional entries.
5. Using Too Many Indicators
→ Adding RSI, MACD, five moving averages, multiple oscillators, and several other tools can make the chart confusing.
More indicators do not necessarily mean better analysis.
6. Ignoring Risk Management
→ Even a correctly identified trend can reverse.
Never assume that identifying the trend guarantees a profitable trade.
Trend Identification Checklist Before Taking a Trade
Before entering a trade, ask yourself:
• [ ] What is the higher-timeframe trend?
• [ ] Is the market making higher highs/higher lows or lower highs/lower lows?
• [ ] Where are the important support and resistance zones?
• [ ] Is price above or below VWAP?
• [ ] What is the moving-average direction?
• [ ] Does volume support the current move?
• [ ] Is momentum supporting the trade?
• [ ] Is the market trending or ranging?
• [ ] Am I entering because of a valid setup or because of FOMO?
• [ ] Where is my stop-loss?
• [ ] What is my potential reward compared with my risk?
• [ ] How much capital am I willing to risk?
If you cannot clearly answer these questions, consider waiting.
Should Beginners Trade Only in the Direction of the Trend?
Trading with the trend can be easier to understand because you are attempting to align with the prevailing market direction.
However, “always trade with the trend” is not a complete trading strategy.
Professional traders may use different approaches, including:
• Trend following
• Breakout trading
• Pullback trading
• Range trading
• Mean reversion
The important thing is to understand what market condition your strategy was designed for.
If your strategy is designed for trending markets, you may want to avoid taking signals when the market is clearly ranging.
How Market Trend Can Change
Trends are not permanent.
An uptrend can become a range and eventually turn bearish.
A downtrend can stabilize and become bullish.
A possible change in trend may be suggested by:
1. Loss of momentum.
2. Failure to create a new high or low.
3. Break of an important market-structure level.
4. Failed breakout.
5. Strong movement in the opposite direction.
6. Formation of a new sequence of highs and lows.
Do not assume that one candle confirms a complete trend reversal.
Look for a meaningful change in structure.
Trend Analysis and Risk Management Go Together
Trend identification is only one part of trading.
Even if you correctly identify an uptrend, your individual trade can still lose money.
For example:
• You enter too late.
• Your stop-loss is too tight.
• A sudden news event causes volatility.
• The market reverses unexpectedly.
• Your position size is too large.
Therefore, trend analysis should always be combined with risk management.
A useful principle is:
Good analysis + poor risk management = dangerous trading
Good analysis + disciplined risk management = a more controlled approach
Neither guarantees profits.
A Simple Framework You Can Remember
If you want a simple framework for daily use, remember:
TREND → LEVEL → SETUP → RISK → TRADE
Trend
→ What direction is the market moving?
Level
→ Where are the important support and resistance areas?
Setup
→ Has your trading strategy actually produced an entry?
Risk
→ Where is the stop-loss and how much are you risking?
Trade
→ Only after the previous steps are clear should you execute the trade.
This prevents you from making the common mistake of starting with the entry instead of starting with market context.
Final takeaway
Learning how to identify the market trend before taking a trade is one of the most useful skills a beginner can develop.
You do not need a complicated chart filled with indicators.
Start with the basics:
Higher timeframe + market structure + support/resistance + price action
Then use tools such as VWAP, moving averages, volume, RSI, or MACD to add context when they genuinely help your strategy.
Most importantly, remember that trend identification is about probability, not certainty.
The market can change direction at any time. A good trader does not try to predict every move. Instead, they build a clear process, wait for their setup, manage risk, and accept that some trades will lose.
The goal is not to predict the market perfectly.
The goal is to make better, more disciplined decisions consistently.
How to Identify Market Trend Before Taking a Trade
Frequently Asked Questions
What is the easiest way to identify a market trend?
→ For beginners, start by looking at market structure. Higher highs and higher lows generally indicate an uptrend, while lower highs and lower lows generally indicate a downtrend. Then confirm the broader context using higher timeframes and key support/resistance levels.
Which timeframe is best for identifying the trend?
→ There is no single best timeframe. It depends on your trading style. Intraday traders can use higher timeframes for context and lower timeframes for entries, while swing traders generally need larger timeframes.
Can I identify the trend using only moving averages?
→ Moving averages can help identify direction, but relying on them alone can produce false signals. Combining them with price structure and important levels can provide better context.
Is VWAP useful for identifying intraday trends?
→ Yes. VWAP can help intraday traders understand whether price is trading above or below the session’s volume-weighted average price. However, VWAP should not be treated as a guaranteed buy or sell signal.
Should I always trade in the direction of the trend?
→ Not necessarily. Your strategy should determine what market conditions you trade. Trend-following strategies generally work best when the market is moving directionally, while other strategies may be designed for ranges or reversals.
What should I do when the trend is unclear?
→ The simplest answer is to wait. If you cannot clearly identify whether the market is bullish, bearish, or ranging, forcing a trade can increase unnecessary risk.
How to Identify Market Trend Before Taking a Trade
Disclaimer
This article is for educational and informational purposes only and should not be considered financial, investment, or trading advice. Stock and derivatives trading involve significant risk, and losses can exceed expectations, particularly when leverage is involved. Always conduct your own research, understand the risks, and consider consulting a qualified financial professional before making investment or trading decisions.
About JD Trading Zone: JD Trading Zone publishes educational content designed to help beginners understand stock market concepts, technical analysis, trading psychology, and risk management. Our goal is to explain complex trading concepts in a simple and practical way.
How to Identify Market Trend Before Taking a Trade
Wow, superb blog layout! How long have you been blogging for? you made blogging look easy. The overall look of your website is great, let alone the content!
dubai escort site
Pingback: How to Confirm a Breakout Before Taking a Trade - jdtradingzone.com
Pingback: Breakout Retest Strategy Explained - jdtradingzone