
Today we will discuss and learn about what backtesting is, how to backtest a trading strategy, which metrics to track, common mistakes to avoid, and how to improve your testing process.
Welcome to JD Trading Zone
Introduction
A trading strategy may look excellent on a chart, but that does not automatically mean it will work consistently in real market conditions.
Before risking real money, traders can use backtesting to study how a strategy would have performed on historical market data.
Backtesting allows you to test your entry rules, exit rules, stop-loss, position sizing, and other conditions without putting actual capital at risk.
For beginners, backtesting is especially useful because it replaces assumptions such as “This strategy looks profitable” with measurable results.
However, backtesting is not a guarantee of future profits. Historical performance can be useful for evaluating a strategy, but markets change and a strategy that performed well in the past can fail in the future.
Also check:- (Common Trading Myths That Cost Traders Money) (Nifty vs Bank Nifty: Which Is Better for Beginners?) (Best Chart Patterns for Trading) (Best Chart Patterns for Trading) (How to Build Consistency in Trading)
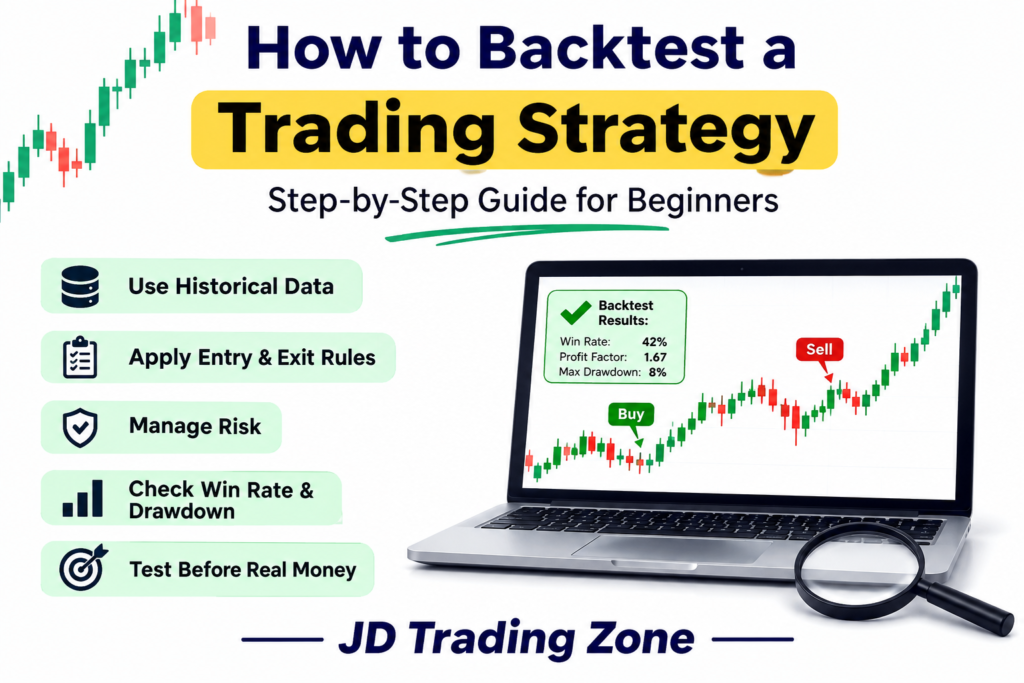
How to Backtest a Trading Strategy
What Is Backtesting in Trading?
Backtesting is the process of applying a defined trading strategy to historical market data to see how it would have performed in the past.
For example, suppose your strategy says:
• Buy when price moves above VWAP.
• Confirm the trend using a moving average.
• Enter only after a candle closes.
• Place a stop-loss below the recent swing low.
• Exit at a predefined risk-to-reward ratio.
You can take historical charts and apply these exact rules to previous market sessions.
The purpose is not to prove that your strategy will make money. Instead, the purpose is to answer questions such as:
• How often did the setup occur?
• How many trades were profitable?
• How large were the losing trades?
• What was the maximum drawdown?
• Did the strategy work better in trending or sideways markets?
• Was the strategy profitable after realistic trading costs?
These answers can help you decide whether a strategy deserves further testing.
Why Should You Backtest a Trading Strategy?
Backtesting has several important benefits.
1. It Gives You Evidence
→ Instead of relying entirely on opinions or social media claims, you can evaluate your own rules using historical data.
2. It Helps Identify Weaknesses
→ A strategy may appear attractive until you test it across hundreds of trades.
Backtesting can reveal problems such as:
• Too many losing trades
• Large drawdowns
• Poor performance during sideways markets
• Weak risk-to-reward characteristics
• Long periods without profitable trades
3. It Builds Confidence
→ A trader who understands how their strategy behaved historically may find it easier to follow their rules during normal periods of losses.
Confidence should come from evidence and discipline, not from believing that every trade will be profitable.
4. It Helps Compare Strategies
→ You can test two different approaches using the same market, timeframe, and testing period.
For example:
Strategy A: VWAP + price action
Strategy B: VWAP + moving average + momentum confirmation
Instead of choosing based on appearance, you can compare their historical results.
How to Backtest a Trading Strategy Step by Step
Step 1: Clearly Define Your Strategy
The first rule of good backtesting is simple:
You need clearly defined trading rules.
Avoid vague instructions such as:
“Buy when the market looks bullish.”
That cannot be tested consistently because different traders may interpret “bullish” differently.
Instead, define objective conditions.
For example:
→ Entry conditions
1. Price is above VWAP.
2. The selected trend indicator confirms an upward trend.
3. A bullish candle closes above a predefined resistance level.
4. Entry occurs at the next candle’s opening price.
→ Exit conditions
1. Stop-loss is placed below the recent swing low.
2. Target is set at 2R.
3. Exit immediately if the stop-loss is hit.
The more objective your rules are, the more reliable your backtest can become.
Step 2: Choose the Market and Timeframe
Decide exactly what you want to test.
Examples include:
• Nifty 50
• Bank Nifty
• Individual stocks
• Currency pairs
• Commodities
• Cryptocurrency
Then select a timeframe such as:
• 5-minute
• 15-minute
• 1-hour
• 4-hour
• Daily
Do not change the timeframe simply because the results look better.
If your strategy is intended for 15-minute intraday trading, test it primarily on the 15-minute timeframe.
Step 3: Select a Suitable Historical Period
Testing only a few days or weeks can produce misleading results.
Markets behave differently during different conditions.
Your testing period should ideally include several types of market environments, such as:
• Strong uptrends
• Strong downtrends
• Sideways markets
• High-volatility periods
• Low-volatility periods
• Major market corrections
The exact amount of historical data depends on the strategy and timeframe.
A strategy designed for intraday trading may require a large number of historical trades, while a longer-term strategy may naturally produce fewer signals.
The key is to collect enough observations to make the results meaningful.
Step 4: Define Your Risk Management Rules
Never backtest only the entry signal.
Risk management is part of the strategy.
Define:
• Maximum risk per trade
• Stop-loss method
• Target method
• Position size
• Maximum number of trades per day
• Maximum daily loss
• Whether positions can be held overnight
For example, a trader may decide to risk only 1% of trading capital per trade.
If the account contains ₹100,000, a 1% maximum risk would be ₹1,000.
However, actual position size depends on the entry price, stop-loss distance, contract specifications, and applicable costs.
Step 5: Create a Trade-Recording System
Record every valid trade rather than only the trades you like.
A useful backtesting journal can contain:
• Trade
• Entry
• Stop-Loss
• Target
• Result
• R-Multiple
• Setup
You can also record:
• Date
• Time
• Market condition
• Screenshot
• Reason for entry
• Reason for exit
• Maximum favorable excursion
• Maximum adverse excursion
• Trading costs
A detailed journal makes it easier to identify patterns in your results.
Step 6: Follow the Rules Without Changing Them
This is one of the most important parts of backtesting.
Suppose you originally decide:
Enter when price closes above resistance.
During testing, you find that some trades would have been better if you had entered slightly earlier.
Do not change the rule halfway through the test.
Changing rules after seeing the outcome can make the results look better than they really are.
Finish the predefined test first.
Then create a new version of the strategy and test that version separately.
Step 7: Include Brokerage and Other Trading Costs
A strategy that appears profitable before costs may become much less attractive after expenses.
Depending on the market and broker, costs can include:
• Brokerage
• Exchange charges
• Taxes
• Regulatory charges
• Slippage
• Bid-ask spread
This is particularly important for high-frequency strategies and strategies with small profit targets.
For example, a strategy that generates ₹150 of expected profit per trade can look very different after ₹50 of combined costs and slippage.
Therefore, try to make your backtest as realistic as possible.
Step 8: Calculate Important Backtesting Metrics
Do not judge a strategy only by its win rate.
Several metrics should be considered together.
Win Rate
Win rate tells you what percentage of trades were profitable.
Formula:
Win Rate = Winning Trades ÷ Total Trades × 100
For example, if 45 out of 100 trades are winners:
Win Rate = 45%
A 45% win rate is not necessarily bad.
If winning trades are significantly larger than losing trades, the strategy can still be profitable.
Average Win
Average win shows how much you make on profitable trades on average.
For example:
Total profit from winning trades = ₹30,000
Number of winning trades = 30
Average win = ₹1,000.
Average Loss
Average loss tells you the average amount lost on losing trades.
Understanding average win compared with average loss is often more useful than looking at win rate alone.
Risk-to-Reward Ratio
Risk-to-reward compares the amount you are willing to lose with your expected potential profit.
For example:
1:2 risk-to-reward
means risking ₹500 to potentially make ₹1,000.
A strategy does not need an extremely high win rate if its average winning trades are sufficiently larger than its average losing trades.
Profit Factor
Profit Factor compares gross profits with gross losses.
Profit Factor = Gross Profit ÷ Gross Loss
For example:
• Gross profit = ₹50,000
• Gross loss = ₹30,000
• Profit Factor = 1.67
A value above 1 means gross profits exceeded gross losses during the tested period.
However, higher is not automatically better. You should also examine the number of trades, drawdown, consistency, and realism of the test.
Maximum Drawdown
Maximum drawdown measures the largest decline from a portfolio’s peak to a subsequent low during the testing period.
For example, if your strategy grows from ₹100,000 to ₹130,000 and later falls to ₹110,000 before recovering, the decline from ₹130,000 to ₹110,000 represents a ₹20,000 drawdown.
Drawdown is extremely important because a strategy may be profitable overall but still experience losses that are psychologically or financially difficult to tolerate.
What Is Expectancy in Trading?
Expectancy estimates the average amount a strategy could theoretically make or lose per trade based on its historical win rate and average wins and losses.
A simplified formula is:
Expectancy = (Win Rate × Average Win) − (Loss Rate × Average Loss)
For example:
• Win rate = 40%
• Average win = ₹2,000
• Loss rate = 60%
• Average loss = ₹1,000
Expectancy:
(0.40 × ₹2,000) − (0.60 × ₹1,000)
= ₹800 − ₹600
= ₹200 per trade
This does not mean that every trade will make ₹200. It is a statistical estimate based on the tested results.
Manual Backtesting vs Automated Backtesting
There are two common approaches.
→ Manual Backtesting
Manual backtesting involves moving through historical charts and recording each trade according to your rules.
Advantages
• Easy to understand
• Useful for beginners
• Helps you study price behaviour
• Can be used for discretionary price-action strategies
Disadvantages
• Time-consuming
• Human error is possible
• Traders may unintentionally introduce hindsight bias
• Manual testing is a good starting point for learning how your strategy behaves.
→ Automated Backtesting
Automated backtesting uses software or code to apply predefined rules to historical data.
Advantages
• Can process large datasets
• Faster for rule-based strategies
• Reduces some forms of human inconsistency
• Makes repeated testing easier
Disadvantages
• Requires precise rules
• Poor-quality data can produce misleading results
• Coding errors can affect results
• Over-optimization can create unrealistic strategies
Automation is powerful, but it does not automatically make a backtest accurate.
What Is Overfitting in Backtesting?
Overfitting occurs when a strategy is adjusted so extensively to historical data that it performs well on that specific dataset but struggles on new data.
For example, imagine repeatedly changing:
• Indicator settings
• Stop-loss distance
• Target
• Trading hours
• Entry conditions
until the historical results look exceptional.
The strategy may simply be fitting the past rather than identifying a robust market behaviour.
A strategy that produces spectacular historical results is not necessarily better than a simpler strategy with more stable performance.
How to Avoid Overfitting
Keep the Strategy Simple
→ Use only indicators and rules that have a clear purpose.
Avoid Excessive Parameter Changes
→ Do not test hundreds of combinations simply to find the best historical result.
Use Out-of-Sample Testing
→ Separate your data into different periods.
For example:
• Development period: used to build the strategy
• Validation period: used to evaluate it
• Out-of-sample period: used to see how it performs on unseen data
Test Different Market Conditions
A strategy should not be judged solely during a favourable market phase.
Common Backtesting Mistakes Beginners Make
1. Looking Into the Future
→ This is known as look-ahead bias.
For example, using information that would not have been available at the exact moment of entry can make historical results unrealistic.
Always make decisions using only information available at that time.
2. Ignoring Slippage
→ Your historical entry may appear to be ₹500, but the actual execution could be slightly different.
Ignoring this can make results look better than real trading.
3. Testing Too Few Trades
→ A strategy that makes money over 10 trades does not necessarily have a reliable edge.
More observations generally provide a better basis for evaluating consistency.
4. Changing Rules After Losing Trades
→ If you keep modifying the strategy every time a trade loses, you can accidentally create a system designed around historical outcomes.
Losses are a normal part of trading.
5. Focusing Only on Win Rate
→ A 70% win rate does not automatically mean a strategy is good.
If the average loss is much larger than the average win, the strategy can still lose money.
6. Ignoring Drawdown
→ A strategy may generate attractive profits while experiencing a drawdown that is too large for your risk tolerance.
Always examine both returns and risk.
Example of a Simple Backtest
Suppose a beginner wants to test a simple intraday strategy.
Strategy Rules
Market: Nifty 50
Timeframe: 15 minutes
Long entry:
Price is above VWAP.
A bullish candle closes above the previous swing high.
Entry is taken after the confirmation candle closes.
Stop-loss:
Below the recent swing low.
Target:
2 times the initial risk.
Now imagine the trader records 100 historical trades.
The results are:
• Winning trades: 42
• Losing trades: 58
• Average winning trade: +2R
• Average losing trade: -1R
The strategy’s simplified expectancy is:
(42% × 2R) − (58% × 1R)
= 0.84R − 0.58R
= +0.26R per trade
This is only an illustrative example, not a claim that the strategy will perform this way in live trading.
The important lesson is that win rate alone does not tell the complete story.
Backtesting Checklist for Beginners
Before considering a backtest complete, ask yourself:
• Are my entry rules clearly defined?
• Are my exit rules clearly defined?
• Did I define stop-loss rules before testing?
• Did I define position sizing?
• Did I test enough trades?
• Did I include different market conditions?
• Did I include realistic costs?
• Did I avoid hindsight and look-ahead bias?
• Did I record losing trades as carefully as winning trades?
• Did I calculate drawdown?
• Did I calculate expectancy?
• Did I avoid excessive optimization?
• Did I test the strategy on unseen data?
• Does the strategy still make sense without relying on perfect historical execution?
If several answers are “no,” the backtest may need more work.
What Should You Do After Backtesting?
A profitable backtest does not mean you should immediately use the strategy with significant real money.
A more cautious process is:
Backtest → Validate → Paper Trade → Small-Size Live Test → Review → Scale Carefully
Paper trading can help you discover differences between historical assumptions and real-time execution.
When moving toward live trading, start with risk that you can comfortably afford to lose rather than assuming historical performance will continue.
Backtesting vs Forward Testing
These two concepts are related but different.
Backtesting
→ Uses historical data to evaluate how a strategy performed in the past.
Forward Testing
→ Applies the strategy to new market data as it becomes available.
Forward testing can help determine whether the strategy behaves similarly outside the historical dataset used to develop it.
Using both methods can provide stronger evidence than relying on backtesting alone.
Profit Enough to Choose a Strategy?
No.
A strategy showing 300% historical returns may appear attractive, but you should investigate how those returns were generated.
Consider:
• Maximum drawdown
• Number of trades
• Average trade
• Profit factor
• Expectancy
• Losing streaks
• Trading costs
• Slippage assumptions
• Market conditions
• Out-of-sample performance
• Complexity of the strategy
A simpler strategy with moderate but consistent historical performance may be more useful than a highly optimized strategy with extraordinary historical returns.
How to Backtest a Trading Strategy
Final takeaway
Backtesting is one of the most useful skills a developing trader can learn.
It allows you to move beyond statements such as “this indicator works” or “this setup looks profitable” and instead examine measurable historical evidence.
But good backtesting requires discipline.
Define your rules before testing, use realistic assumptions, record every trade, include costs, measure drawdown and expectancy, and avoid changing the rules simply to improve historical results.
Most importantly, remember that backtesting is a research tool, not a crystal ball. Markets can behave differently in the future, and historical performance cannot guarantee future results.
For beginners, the goal should not be to find a strategy with the most impressive backtest. The better goal is to find a clear, testable and reasonably robust process that you understand and can follow with disciplined risk management.
Frequently Asked Questions
What is the easiest way to backtest a trading strategy?
→ Beginners can start with manual backtesting using historical charts and a spreadsheet. Write the strategy rules first and record every qualifying trade without changing the rules during the test.
How many trades should I backtest?
→ There is no universal number that works for every strategy. More trades generally provide more useful evidence, but the required sample depends on the strategy, timeframe, market, and frequency of setups.
Can backtesting guarantee profits?
→ No. Backtesting only shows how a strategy behaved under historical conditions. Future market behaviour can be different.
Is a 50% win rate good?
→ It depends on the relationship between average winning and losing trades, costs, and drawdown. A strategy with a 50% win rate can be profitable or unprofitable depending on its risk-to-reward profile.
Should beginners use automated backtesting?
↓ Automated testing can be useful, but beginners should first understand the strategy and its rules. A computer can process data quickly, but it cannot fix poorly designed rules or poor-quality assumptions.
What is the biggest backtesting mistake?
→ One of the biggest mistakes is changing the strategy after seeing historical results. This can create overfitting and make the strategy appear stronger than it really is.
How to Backtest a Trading Strategy
Risk Disclaimer
This article is for educational and informational purposes only. Backtested or hypothetical results do not guarantee future performance. Trading stocks, futures, options and other financial instruments involves risk, and losses can exceed expectations. Always conduct your own research, understand the risks involved, and consider seeking advice from a qualified financial professional before making investment or trading decisions.
About JD Trading Zone:
JD Trading Zone publishes educational content about trading, technical analysis, risk management, market concepts and trading psychology to help beginners understand financial markets more responsibly.
Pingback: Trading Journal: Why Every Trader Needs One - jdtradingzone.com
Pingback: How to Identify Market Trend Before Taking a Trade - jdtradingzone.com
Pretty! This was a really wonderful post. Thank you for your provided information.