
A common problem for new intraday traders is not the lack of strategies.
It is having too many strategies.
One chart has RSI. Another has MACD.
Then comes VWAP, multiple EMAs, support and resistance, volume, candlestick patterns and several different entry rules.
Eventually, the trader has so many signals that taking a trade becomes confusing.
I prefer a different approach:
Build one complete setup and learn to execute it repeatedly before adding anything else.
The idea is not to predict every market move. The objective is to wait until several pieces of information point in the same direction and then take a predefined trade with controlled risk.
This is an educational framework, not a guaranteed-profit strategy or a recommendation to buy or sell any security.
Also check:- (Opening Range Breakout Strategy: A Practical Guide for Intraday Traders in India) (How to Choose Stocks for Intraday Trading in India) (Volume and Price Action Trading Strategy) (Breakout Retest Strategy Explained)
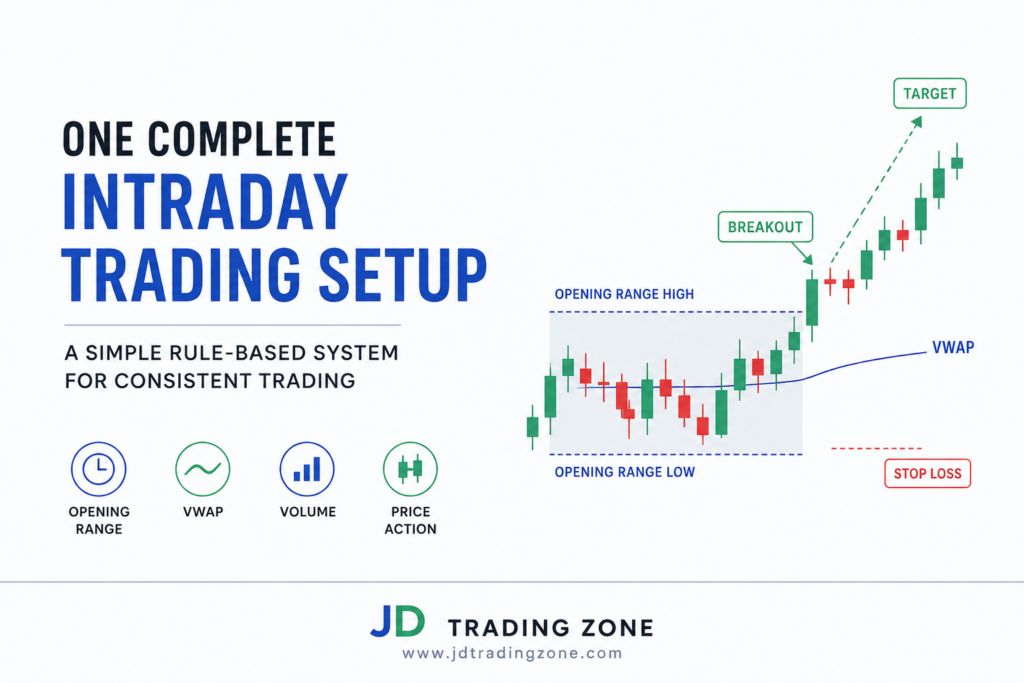
The Setup at a Glance
Here is the complete structure:
Component
• Market
• Chart
• Opening Range
• Main indicator
• Confirmation
• Long bias
• Short bias
• Entry
• Stop Loss
• Minimum R:R
• Daily trades
• Exit
Rule
• Liquid Indian stocks
• 5-minute
• First 15 minutes
• VWAP
• Volume + price action
• Price above VWAP
• Opening-range breakout + confirmation
• Structure-based
• Preferably 1:2
• Maximum 2 quality attempts
• Target, stop or end-of-day rule
The important part is that each component has a job.
The opening range tells us where the early battle occurred.
VWAP gives us an intraday reference for price location.
Volume tells us whether participation is increasing.
Price action tells us whether the breakout is actually holding.
Step 1: Do Not Start With the Chart
The first mistake I would avoid is opening the chart at 9:15 AM and immediately searching for an entry.
The first few minutes can be extremely fast.
Instead, prepare your watchlist before the market opens.
Look for stocks that have:
• Good liquidity
• Reasonable trading volume
• A clean chart
• Sufficient intraday movement
• No obvious abnormal spread
• A reason for attention, such as market strength, sector momentum or company-related news
You do not need 20 stocks.
A watchlist of around 3–5 liquid stocks is enough for practice.
The purpose is not to find a stock that will definitely rise.
The purpose is to find stocks where a clean setup could develop.
Step 2: Let the First 15 Minutes Happen
This is where the setup becomes interesting.
From 9:15 AM to 9:30 AM, don’t chase the first move.
Mark:
• Opening Range High
• Opening Range Low
This creates your initial battlefield.
For example:
Suppose a stock trades between:
High = ₹1,025
Low = ₹1,005
The opening range is:
₹1,005–₹1,025
Now I don’t care whether the stock looks bullish at ₹1,010.
I want to know what happens when price approaches the boundaries.
That small change in thinking can make the strategy much more disciplined.
Step 3: Add VWAP
Now add VWAP to the 5-minute chart.
VWAP is useful as an intraday reference because it incorporates traded volume rather than simply averaging prices.
Traders commonly use it to judge whether price is trading above or below an intraday volume-weighted reference.
For this setup, keep the interpretation simple.
Bullish environment
Price is:
Above VWAP
and VWAP is preferably moving upward.
Bearish environment
Price is:
Below VWAP
and VWAP is preferably moving downward.
Avoid
Price repeatedly crossing VWAP with no clear direction.
That often indicates that the market is not giving the clean directional environment this setup needs.
Step 4: Wait for the Breakout
Now we have our opening range.
Suppose:
• Opening Range High = ₹1,025
• Opening Range Low = ₹1,005
• Price = ₹1,018
• VWAP = ₹1,012
Price is above VWAP, which gives us a bullish bias.
But I still don’t buy at ₹1,018.
Why?
Because the stock has not broken the opening range.
The important level is ₹1,025.
I want price to push through that level and show that buyers are actually willing to trade above the opening range.
Step 5: Don’t Buy the First Spike Automatically
This is one of the most important parts of the setup.
A candle moving above the opening-range high does not automatically mean a valid breakout.
Sometimes price moves above the level for a few seconds and immediately falls back.
That is exactly the type of move that can trap impatient traders.
Instead, look for:
1. Price to break the opening-range high.
2. A 5-minute candle to close above the level.
3. Volume to be meaningful compared with recent candles.
4. Price to remain above VWAP.
5. The breakout candle not to look excessively stretched.
This creates a much more selective entry.
Volume can support the breakout analysis, but it should not be treated as a magic confirmation. A breakout still needs sensible price structure and risk.
The Long Setup
Let’s put everything together.
Long conditions
A long trade is considered only when:
• The first 15-minute range is established.
• Price breaks the opening-range high.
• A 5-minute candle closes above that level.
• Price is above VWAP.
• VWAP is not strongly declining.
• Breakout volume is stronger than the recent background.
• The breakout does not immediately collapse back into the range.
• There is enough room for a reasonable target.
If several of these conditions are missing, there is no trade.
That last sentence is important.
No setup = no trade.
A Practical Long Example
Imagine this situation:
Opening Range High: ₹1,025
Opening Range Low: ₹1,005
VWAP: ₹1,014
At 9:40 AM, price moves to ₹1,026.
The candle closes at ₹1,028 with stronger volume.
Price remains above VWAP.
This gives us a potential long setup.
Instead of blindly entering because price touched ₹1,025, we now have a structured breakout.
Suppose the planned entry is around:
₹1,028
And the technical invalidation level is around:
₹1,018
The risk per share would be approximately:
₹10
If the planned reward is twice the risk:
Target = ₹1,048
This gives a theoretical 1:2 risk-to-reward relationship before costs and slippage.
The numbers are only an example. Real trades must use the actual chart structure.
Where Should the Stop Loss Go?
A stop loss should not be chosen simply because a certain number of points “sounds safe.”
It should be connected to the reason for entering.
For a long breakout, possible invalidation areas include:
• Below the breakout structure
• Below a successful retest
• Below a nearby swing low
• Below the opening-range boundary, if the range structure supports that risk
The exact stop depends on the stock’s volatility and chart structure.
The basic question is:
At what price would my original trade idea become invalid?
That is a much better question than:
“How many points should my stop be?”
Also remember that a stop order does not guarantee that the final execution will occur exactly at your intended stop price during fast or illiquid conditions.
The Short Setup
The same idea works in the opposite direction.
For a short trade, look for:
• First 15-minute range established
• Price below VWAP
• VWAP preferably declining
• Breakdown below the opening-range low
• 5-minute candle closes below the range
• Volume supports the move
• Price does not immediately recover into the range
For example:
Opening Range High: ₹1,025
Opening Range Low: ₹1,005
VWAP: ₹1,015
Price falls below ₹1,005.
A 5-minute candle closes at ₹1,000 with strong participation.
Price remains below VWAP.
This creates a potential short setup.
Again, the stop should be based on the structure that invalidates the trade—not an arbitrary number.
The Retest: My Preferred Entry Improvement
There is another way to approach the breakout.
Instead of buying the first breakout candle, wait for a retest.
For a bullish breakout:
Range High → Breakout → Pullback → Hold → Entry
For a bearish breakdown:
Range Low → Breakdown → Pullback → Rejection → Entry
The advantage is that you are no longer chasing the initial candle.
Suppose the stock breaks ₹1,025 and reaches ₹1,033.
Instead of immediately buying at ₹1,033, price comes back toward ₹1,025.
If buyers defend the level and price produces a bullish reaction, the retest can provide a more controlled entry.
But there is an important catch:
Not every breakout will retest.
If the stock runs without coming back, don’t chase it.
Missing a trade is cheaper than turning a good strategy into an emotional trade.
What About Volume?
Volume is best treated as supporting evidence.
Imagine two breakouts.
Breakout A
Price moves above resistance with noticeably higher volume and closes strongly.
Breakout B
Price barely moves above resistance while volume is weak and the candle closes near its low.
I would naturally have more interest in Breakout A.
But volume alone is not enough.
A high-volume candle can also represent aggressive selling, profit booking or a temporary news-driven spike.
So the sequence matters:
Level + price action + VWAP + volume
rather than:
Volume = Buy
Position Sizing: The Part Most Beginners Ignore
This may be more important than the entry itself.
Suppose your trading capital is:
₹1,00,000
You decide that the maximum planned risk on one trade is:
0.5%
That means your maximum planned loss is:
₹500
Now suppose your entry is:
₹1,028
and your stop is:
₹1,018
Risk per share:
₹10
Position size:
₹500 ÷ ₹10 = 50 shares
So instead of deciding:
“I’ll buy 500 shares because the stock looks strong.”
you decide:
“My maximum planned risk is ₹500, so the position size must fit the stop.”
This is a fundamentally different approach.
Position Size Formula
Position Size = Maximum Rupee Risk ÷ Risk
Per Share
For example:
₹500 ÷ ₹10 = 50 shares
If the calculated quantity is too large for your comfort or margin, reduce the size or skip the trade.
What If the Stop Is Too Wide?
This is where many traders make a serious mistake.
Suppose your maximum risk is ₹500.
Your setup requires a ₹25 stop.
Then:
₹500 ÷ ₹25 = 20 shares
That’s fine.
But if the stock’s minimum practical quantity or derivatives contract size makes the intended risk much larger than your limit, don’t force the trade.
A trade is not compulsory just because the setup looks good.
Sometimes the correct decision is simply:
Skip.
Target: Don’t Pick Random Numbers
A target should be decided before entering.
For example, if your planned risk is ₹10 per share:
1R
₹10 reward
2R
₹20 reward
3R
₹30 reward
So if entry = ₹1,028 and risk = ₹10:
1R = ₹1,038
2R = ₹1,048
3R = ₹1,058
But there is another consideration.
A 2R target is useless if major resistance sits directly in front of it.
Before entering, check:
• Previous day high
• Previous day low
• Important support/resistance
• Intraday swing levels
• Nearby supply/demand zones
• Current volatility
You want the chart to provide enough room for the trade to breathe.
What I Would Do After Entry
Let’s say the trade is entered at ₹1,028.
Stop:
₹1,018
Target:
₹1,048
Now the difficult part begins.
The market starts moving.
₹1,032
₹1,035
₹1,031
₹1,037
This is where traders often interfere with their own strategy.
They move the stop randomly.
They exit because of a small red candle.
They double the position after a pullback.
They move the target farther because the trade is winning.
Instead, follow the plan.
If the trade reaches the predetermined management point, manage it according to your rules.
Don’t let every candle rewrite the strategy.
When Should You Exit Early?
A trade can be exited before the final target when the original thesis clearly fails.
For example:
Price falls back inside the opening range.
VWAP structure changes sharply against the position.
A breakout becomes an obvious failed breakout.
A major unexpected event creates abnormal volatility.
The market becomes too choppy for the setup.
The key is to distinguish between:
normal price fluctuation
and
actual invalidation.
If you exit every time a candle moves against you, your stop effectively becomes emotional.
The Two-Trade Rule
One rule I particularly like for beginners is:
Maximum two planned attempts per day.
Why?
Because after a losing trade, the temptation is to “win it back.”
Then another trade appears.
Then another.
Soon the trader isn’t following the strategy anymore.
They are trying to repair their P&L.
Two attempts create a natural barrier against revenge trading.
You can make the rule even stricter:
After two losing trades, the trading day is finished.
When I Would NOT Trade This Setup
A strategy becomes more useful when you define its no-trade conditions.
I would avoid forcing this setup when:
1. Price keeps crossing VWAP
This suggests that the market may not have a clear intraday direction.
2. The opening range is extremely wide
A huge opening range can create an uncomfortable stop distance.
3. Breakout occurs with no meaningful follow-through
Price breaks the level and immediately returns inside.
4. The stock is illiquid
Wide spreads and poor execution can damage an otherwise good setup.
5. A major event is creating abnormal volatility
News can cause sudden price movements that are difficult to manage.
6. The target is blocked by nearby resistance
A theoretically attractive setup may have very little practical room.
7. You are already emotionally tilted
If you are angry after a previous loss or desperate to make money that day, the best trade may be no trade.
A Complete Long Trade Checklist
Before clicking Buy, ask:
• [ ] Is the stock liquid enough?
• [ ] Has the first 15-minute range formed?
• [ ] Has price broken the range high?
• [ ] Did the candle close above the level?
• [ ] Is price above VWAP?
• [ ] Is VWAP supportive of the direction?
• [ ] Is volume supportive?
• [ ] Is the breakout clean rather than excessively extended?
• [ ] Do I know exactly where the setup becomes invalid?
• [ ] Is my position size calculated from risk?
• [ ] Is there enough room for my target?
• [ ] Is the potential reward worth the risk?
• [ ] Am I taking this trade because of the setup—not because I want action?
If several answers are “No,” skip it.
A Complete Short Trade Checklist
Before clicking Sell/Short:
• [ ] Is the stock liquid?
• [ ] Has the opening range formed?
• [ ] Has price broken the range low?
• [ ] Did the candle close below the level?
• [ ] Is price below VWAP?
• [ ] Is VWAP supportive of the bearish direction?
• [ ] Is volume supportive?
• [ ] Has the breakdown avoided an immediate recovery?
• [ ] Is the invalidation level clearly defined?
• [ ] Is position size based on maximum risk?
• [ ] Is there sufficient room to the target?
• [ ] Is the expected reward reasonable?
• [ ] Am I following the plan rather than chasing the move?
A Full Day Example
Let’s imagine a hypothetical stock called ABC Ltd.
At 9:15 AM, trading begins.
From 9:15–9:30:
High = ₹820
Low = ₹810
Therefore:
Opening Range = ₹810–₹820
VWAP after the opening period is around:
₹815
Price then moves:
₹817 → ₹819 → ₹821
A 5-minute candle closes at ₹822.
Volume is higher than the preceding candles.
Price remains above VWAP.
The breakout looks clean.
Suppose your planned entry is:
₹822
Your structural stop is:
₹817
Risk per share:
₹5
If your maximum trade risk is ₹500:
Position size = ₹500 ÷ ₹5 = 100 shares
A 2R target would be:
₹822 + ₹10 = ₹832
So your basic trade plan becomes:
Entry: ₹822
Stop: ₹817
Risk: ₹5/share
Quantity: 100 shares
2R Target: ₹832
If the trade works, the gross theoretical reward is ₹1,000.
If the stop is hit, the planned loss is ₹500, before considering brokerage, taxes, slippage and other applicable charges.
The important point is not whether ABC reaches ₹832.
The important point is that the trade was defined before entering it.
Why This Setup Can Be Easier to Learn
This approach deliberately limits the number of decisions.
You are not asking:
“Should I buy because RSI is 62?”
Then:
“Should I wait because MACD is negative?”
Then:
“What is EMA 9 doing?”
Instead, you have a sequence:
Opening Range → VWAP → Breakout → Volume → Price Action → Risk → Entry
That makes the setup easier to journal and test.
It also makes mistakes easier to identify.
For example, after 50 trades you might discover:
Breakout entries perform better than immediate entries.
Retests give fewer but cleaner opportunities.
Certain stocks produce too many false breakouts.
Trades after a particular time perform poorly.
Your stop is consistently too tight.
You are exiting winners too early.
That information is far more valuable than adding another indicator.
The Most Important Number Is Not Win Rate
Suppose Strategy A wins:
70% of trades
but its average winner is small and its losses are large.
Strategy B wins:
45% of trades
but its winners are much larger than its losers.
Strategy B can still be profitable.
For example:
10 trades:
5 winners × +2R = +10R
5 losers × -1R = -5R
Net:
+5R
That is why I would focus on the complete distribution of results rather than chasing a strategy with an impressive win-rate percentage.
A Simple Daily Routine
You can turn the entire setup into a routine.
Before Market
8:45–9:10 AM
• Check the broader market
• Review important news
• Create a shortlist
• Mark major previous-day levels
• Decide your maximum daily loss
9:15–9:30 AM
Observe.
Build the opening range.
Don’t feel pressured to trade.
9:30 AM Onward
Look for:
Breakout + VWAP + Volume + Price Action
Only take the cleanest opportunities.
After the Trade
Record:
• Screenshot
• Entry
• Stop
• Target
• Result in R
• Why you entered
• Why you exited
• Whether you followed the rules
End of Day
Ask:
Did I follow my strategy today?
That question is more useful than simply asking:
Did I make money today?
Common Mistakes With This Setup
Mistake 1: Entering Before the Range Breaks
If the range has not broken, there is no ORB trade.
Mistake 2: Chasing a Large Candle
A huge breakout candle can leave very little room for a sensible stop and target.
Mistake 3: Ignoring VWAP
A breakout directly into an opposing VWAP structure may have lower-quality context.
Mistake 4: Increasing Quantity After a Loss
Never increase position size simply because the previous trade lost.
Mistake 5: Moving the Stop Further Away
If the stop is hit, accept the predefined loss.
Moving it farther turns risk management into hope.
Mistake 6: Taking Every Breakout
A breakout is not automatically a quality breakout.
Context matters.
Mistake 7: Over-Optimizing
Changing the setup every few trades prevents you from discovering whether the original rules actually work.
Can This Setup Guarantee Profit?
No.
And any article claiming that a particular intraday setup can guarantee daily income should immediately make you cautious.
Markets change.
Some days trend strongly.
Some days remain trapped in a narrow range.
Some breakouts work beautifully.
Others fail within minutes.
Even a well-defined setup can experience losing streaks.
The objective is therefore not:
“Find a strategy that never loses.”
The realistic objective is:
“Find a repeatable process where risk is controlled and the results can be measured.”
The One-Page Version
If you want to simplify everything in this article, remember this:
1. Select
Choose a small list of liquid stocks.
2. Observe
Let the first 15 minutes form the opening range.
3. Mark
Draw the opening-range high and low.
4. Filter
Use VWAP to determine the intraday directional environment.
5. Wait
Don’t chase the first move.
6. Confirm
Look for a clean breakout/breakdown with supportive volume and price action.
7. Calculate
Determine your stop and position size before entering.
8. Execute
Take the trade only if the complete setup is present.
9. Manage
Don’t randomly move the stop or target.
10. Review
Record the trade and improve the process—not the emotions.
Final verdict
A good intraday trading setup does not need ten indicators.
In fact, adding more indicators can sometimes make a trader slower rather than better.
The framework discussed here uses a simple idea:
Let the market show its initial range, identify which side has control, wait for confirmation, and risk a predefined amount when the setup appears.
The real work starts after learning the rules.
You need to test them.
Journal them.
Identify when they fail.
Measure your results.
And most importantly, learn to stay out when the setup is not there.
That last skill is often overlooked.
A trader does not make money because they trade every move.
They become more consistent by becoming selective about which moves deserve their risk.
Disclaimer: This article is for educational purposes only and should not be considered investment advice, a recommendation, or a guarantee of profit. Intraday trading involves substantial risk. Actual results can differ because of market conditions, brokerage charges, taxes, slippage, liquidity and execution quality. Always understand the risks and test a strategy appropriately before using real money.
Pingback: Why Good Trading Setups Fail: 9 Reasons Behind Losing Trades - jdtradingzone
Pingback: Best Time to Trade in the Indian Stock Market - jdtradingzone