
Hello guys today we will discuss the Best Candlestick Patterns for Intraday Trading, how they work, when to use them, and the common mistakes to avoid.
Welcome to JD Trading Zone
Candlestick patterns are one of the most powerful tools used by intraday traders. They help traders understand market psychology and identify possible buying or selling opportunities before a major move happens.
However, many beginners make the mistake of trading every candlestick pattern they see. The truth is that no candlestick pattern is accurate all the time. Their success depends on market trend, volume, support and resistance, and overall market conditions.
Also check:- (100 Stock Market Terms Every Beginner Should Know) (Common Chart Patterns Every Trader Must Know) (How to Analyze Volume in the Stock Market Like a Pro) (Top 10 Free Trading Tools Every Trader Should Use) (Swing Trading vs Intraday Trading: Which Is Better for Beginners?)
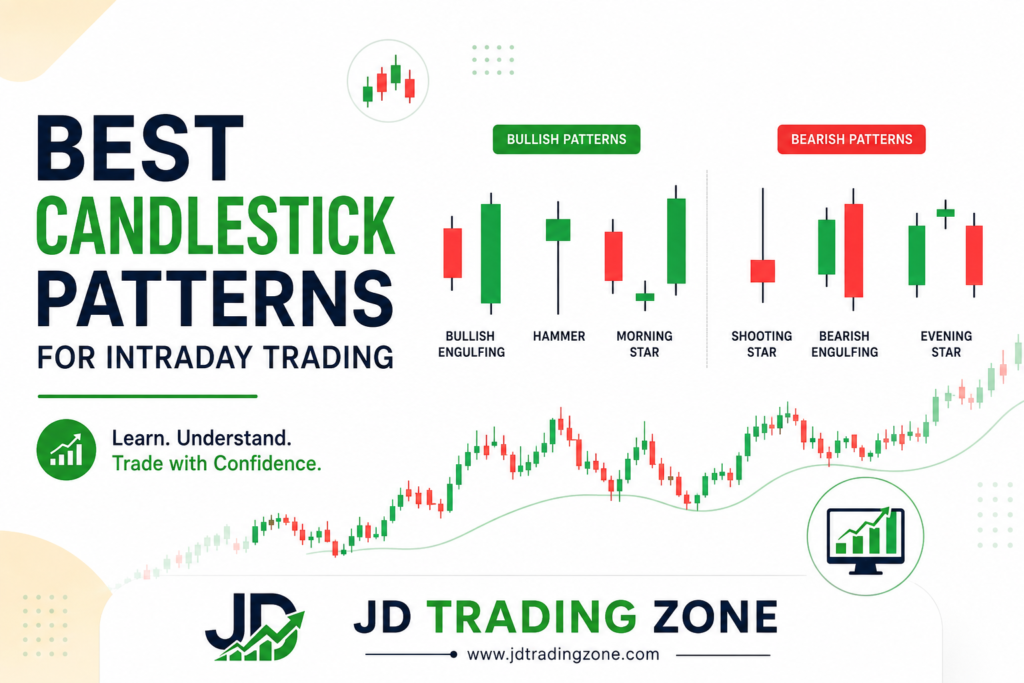
Best Candlestick Patterns for Intraday Trading
What Is a Candlestick Pattern?
A candlestick represents the price movement of a stock or index during a specific time period.
Each candlestick shows:
• Opening price
• Closing price
• Highest price
• Lowest price
When multiple candlesticks form a recognizable shape, they create a candlestick pattern that may indicate a continuation or reversal of the current trend.
Why Candlestick Patterns Matter in Intraday Trading
Candlestick patterns help traders:
• Identify trend reversals
• Spot trend continuation
• Find potential entry points
• Plan stop-loss placement
• Improve trade timing
• Understand buyer and seller strength
Instead of guessing market direction, traders use these patterns as confirmation before entering a trade.
1. Bullish Engulfing Pattern
A Bullish Engulfing pattern appears after a short downtrend.
→ Characteristics
• First candle is bearish.
• Second candle is bullish.
• Second candle completely engulfs the previous candle.
→ What It Means
Buyers have taken control after sellers became weak.
→ Entry
Enter after the bullish candle closes or on a slight pullback.
→ Stop Loss
Below the low of the engulfing candle.
→ Best Used At
• Support zones
• VWAP support
• Moving averages
• Previous day’s low
2. Bearish Engulfing Pattern
This is the opposite of the bullish engulfing.
→ Characteristics
• First candle is bullish.
• Second candle is bearish.
• Bearish candle fully covers the previous bullish candle.
→ Signal
Strong selling pressure.
→ Best Used At
• Resistance
• Previous day’s high
• Supply zones
3. Hammer Pattern
The Hammer forms after a decline.
→ Features
• Small body
• Long lower shadow
• Little or no upper shadow
→ Meaning
Sellers pushed prices lower, but buyers recovered strongly.
This often signals a possible bullish reversal.
4. Shooting Star
The Shooting Star appears after an uptrend.
→ Features
• Small body
• Long upper wick
• Small lower wick
→ Meaning
Buyers tried to move prices higher, but sellers took control.
Often indicates a bearish reversal.
5. Doji Pattern
A Doji forms when opening and closing prices are almost equal.
→ Meaning
The market is undecided.
By itself, a Doji is not a buy or sell signal. Wait for the next candle to confirm the direction.
6. Morning Star Pattern
The Morning Star is a three-candle bullish reversal pattern.
→ Structure
1. Large bearish candle
2. Small indecisive candle
3. Strong bullish candle
→ Meaning
Selling pressure is fading and buyers are gaining strength.
7. Evening Star Pattern
The Evening Star is the bearish version of the Morning Star.
→ Structure
1. Large bullish candle
2. Small candle
3. Strong bearish candle
→ Meaning
Buyers are losing momentum, and sellers may take control.
8. Piercing Pattern
This bullish reversal pattern appears after a downtrend.
The second candle opens below the previous candle but closes above the midpoint of the first candle.
This indicates improving buying pressure.
9. Dark Cloud Cover
This is a bearish reversal pattern.
The second candle opens above the previous high but closes below the midpoint of the bullish candle.
It suggests that sellers are becoming stronger.
10. Three White Soldiers
This pattern consists of three consecutive bullish candles.
→ Characteristics
• Higher highs
• Strong closes
• Small wicks
This often indicates a strong bullish trend.
11. Three Black Crows
The opposite of Three White Soldiers.
It consists of three consecutive bearish candles and usually signals strong selling momentum.
How to Use Candlestick Patterns Correctly
Never trade a candlestick pattern alone.
Always combine it with:
• Support and resistance
• Volume analysis
• VWAP
• Trend direction
• Moving averages
• Market structure
When multiple factors support the same trade idea, the probability of success improves.
Best Timeframes for Intraday Candlestick Trading
Most intraday traders use:
• 5-minute chart
• 15-minute chart
• 30-minute chart
For trend confirmation, many traders also check the 1-hour chart before entering trades.
Risk Management Tips
Even the strongest candlestick pattern can fail.
Follow these rules:
• Risk only 1–2% of your trading capital per trade.
• Always use a stop-loss.
• Avoid revenge trading.
• Do not overtrade.
• Wait for confirmation before entering.
• Stick to your trading plan.
Risk management is more important than finding the “perfect” candlestick pattern.
Common Mistakes Beginners Make
Many new traders lose money because they:
• Trade every candlestick they see.
• Ignore the overall trend.
• Enter before the candle closes.
• Ignore trading volume.
• Skip stop-loss orders.
• Expect every pattern to work.
Patience and discipline are essential for consistent trading.
Which Candlestick Pattern Is the Most Reliable?
There is no single “best” candlestick pattern.
However, many experienced intraday traders frequently use:
• Bullish Engulfing
• Bearish Engulfing
• Hammer
• Shooting Star
• Morning Star
• Evening Star
These patterns become much more reliable when they appear near important support or resistance levels with strong volume confirmation.
Frequently Asked Questions (FAQs)
Which candlestick pattern is best for intraday trading?
→ Bullish Engulfing, Bearish Engulfing, Hammer, Shooting Star, and Morning Star are among the most commonly used patterns. Their effectiveness improves when combined with trend analysis, volume, and support or resistance.
Can I trade using only candlestick patterns?
→ No. Candlestick patterns should be used with other technical analysis tools such as volume, VWAP, moving averages, and market structure.
Which timeframe is best for beginners?
→ The 5-minute and 15-minute charts are popular for intraday trading. Beginners should also check a higher timeframe to understand the overall trend.
Do candlestick patterns guarantee profits?
→ No. They provide potential trading signals, not guarantees. Proper risk management and trade confirmation are essential.
How can I improve my success rate?
→ Wait for confirmation, trade with the trend, use stop-loss orders, and avoid making decisions based on a single candlestick.
Best Candlestick Patterns for Intraday Trading
Final words
Candlestick patterns are an important part of technical analysis because they reflect the ongoing battle between buyers and sellers. They can help identify potential trading opportunities, but they should never be used in isolation.
The most successful intraday traders combine candlestick patterns with trend analysis, support and resistance, volume, and disciplined risk management. Focus on mastering a few high-quality patterns, practice them consistently, and keep a trading journal to review your results.
Over time, this approach can help you make more informed and confident trading decisions.
Disclaimer: This article is for educational purposes only and should not be considered financial or investment advice. Trading in the stock market involves risk. Always conduct your own research and consult a qualified financial advisor before making investment decisions.
Pingback: How to Trade Breakouts Successfully - jdtradingzone.com
Pingback: EMA Crossover Strategy Explained - jdtradingzone.com
Pingback: Fake Breakouts vs Real Breakouts - jdtradingzone