
Are you interested in breakout retest like trading then explore Breakout Retest Strategy, how to identify a quality setup, where to enter, where to place a stop-loss, how to set targets, common mistakes, and how beginners can practice the strategy.
Welcome to JD Trading Zone
A breakout can look exciting when price suddenly moves above resistance or below support. But entering immediately after the breakout can sometimes lead to frustrating losses when price quickly returns to the breakout area.
This is where the breakout retest strategy can be useful.
Instead of chasing price after a breakout, traders wait for price to return to the broken support or resistance level. If the old level behaves as a new support or resistance and price shows confirmation, the trader looks for a possible entry.
This approach can help traders avoid some false breakouts and enter trades with a more clearly defined risk level.
However, no breakout strategy guarantees profits. Market conditions, volatility, liquidity, news, and risk management can significantly affect the outcome.
Also check:- (How to Confirm a Breakout Before Taking a Trade) (How to Identify Market Trend Before Taking a Trade) (Rules of Option Trading for Beginners) (Best Free Websites for Stock Market Analysis) (Position Sizing Explained)
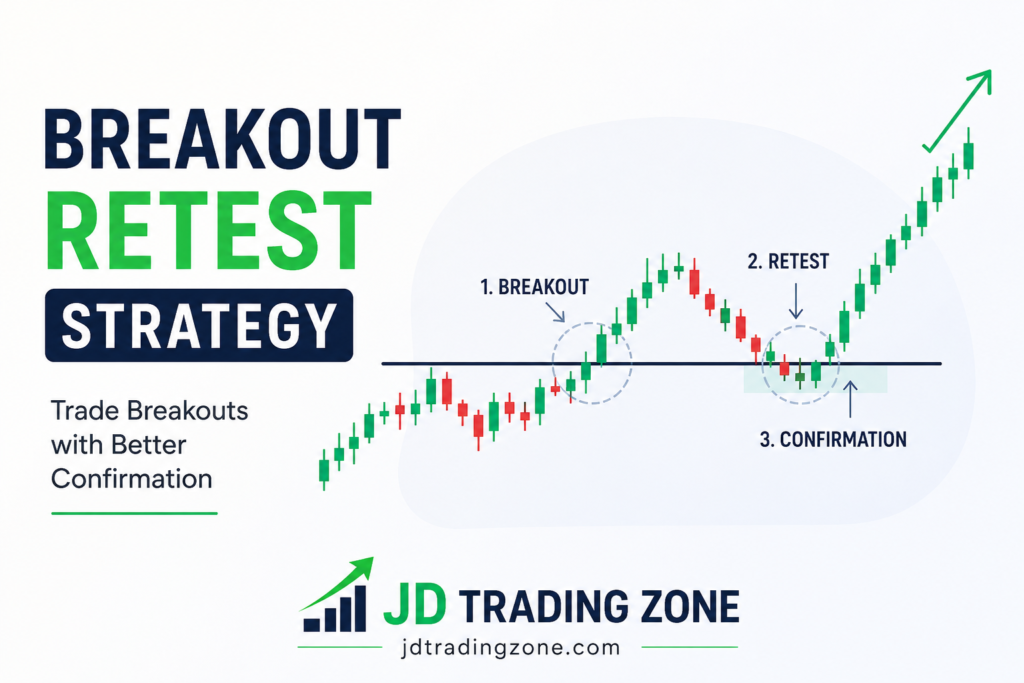
Breakout Retest Strategy Explained
What Is a Breakout Retest?
A breakout retest occurs when price breaks through an important support or resistance level and then returns to test that same area.
For example, imagine a stock has repeatedly struggled to move above ₹500.
₹500 becomes an important resistance level.
If the stock moves above ₹500 with convincing buying pressure, that is a breakout.
Instead of buying immediately, a trader may wait.
If price later falls back toward ₹500 and then finds buying support around that area, the level may be acting as new support.
If price moves upward again after the retest, it can create a potential breakout-retest entry.
The basic idea is:
Resistance → Breakout → Retest → Confirmation → Potential Entry
For a bearish setup, the process can be reversed:
Support → Breakdown → Retest → Rejection → Potential Short Entry
Why Do Traders Wait for a Retest?
One of the biggest problems with trading breakouts is that not every breakout is genuine.
Sometimes price moves above resistance for a short period and then quickly falls back below it.
This is commonly known as a false breakout or failed breakout.
Waiting for a retest gives the trader another opportunity to evaluate whether the broken level is actually being accepted at the new price area.
A retest can potentially provide:
• Better entry confirmation
• A more logical stop-loss location
• Reduced need to chase price
• A clearer invalidation point
• Better trade planning
• But there is an important trade-off.
Not every breakout will retest the level.
Sometimes price breaks out and continues moving without coming back. Waiting for a retest can therefore mean missing some profitable moves.
The goal is not to catch every move. The goal is to take trades that fit your predefined setup.
How the Breakout Retest Strategy Works
The strategy can be divided into five main stages.
Step 1: Identify an Important Level
Start by finding a meaningful support or resistance area.
Look for levels where price has reacted multiple times.
For example:
• Previous swing highs
• Previous swing lows
• Range boundaries
• Major consolidation zones
• Important chart structures
• Clearly visible support and resistance areas
Avoid treating every tiny price fluctuation as a major level.
A stronger level generally has more evidence behind it.
Step 2: Wait for the Breakout
Once an important level has been identified, wait for price to break it.
For a bullish setup, price should move above resistance.
For a bearish setup, price should move below support.
A candle merely touching or slightly crossing a level does not automatically mean a valid breakout.
The quality of the breakout matters.
Step 3: Wait for the Retest
After the breakout, don’t automatically chase the price.
Wait to see whether price returns toward the broken level.
For example:
Resistance at ₹500
Price moves:
₹480 → ₹490 → ₹502 → ₹510
The move above ₹500 is the breakout.
If price later returns:
₹510 → ₹505 → ₹501 → ₹500
the ₹500 area becomes the potential retest zone.
The trader now watches price behaviour around that area.
Step 4: Look for Confirmation
A retest alone is not necessarily a trading signal.
Price may return to the level and break straight back through it.
Therefore, many traders look for additional confirmation.
Possible confirmation signals include:
• Strong rejection candle
• Bullish or bearish engulfing candle
• Pin bar or rejection wick
• Strong momentum candle
• Higher low after a bullish retest
• Lower high after a bearish retest
• Volume expansion
• Break of a nearby short-term structure
The exact confirmation method should be tested before using it with real money.
Step 5: Plan the Trade Before Entering
Before entering, determine:
• Entry price
• Stop-loss
• Target
• Risk amount
• Position size
• Conditions that would invalidate the setup
This is an important part of the strategy.
A good-looking chart does not automatically make a good trade.
Bullish Breakout Retest Example
Let’s use a simple hypothetical example.
Suppose a stock has resistance near ₹1,000.
Price has tested ₹1,000 several times but failed to move above it.
Eventually, price closes above ₹1,000.
This creates a potential bullish breakout.
Instead of immediately buying at ₹1,015, the trader waits.
Price later falls back toward ₹1,000.
During the retest, price briefly moves below ₹1,000 but quickly recovers and forms a strong bullish candle.
The trader may consider an entry after confirmation.
A possible plan could look like this:
Resistance: ₹1,000
Breakout: Above ₹1,000
Retest: Around ₹1,000–₹1,005
Entry: After bullish confirmation
Stop-loss: Below the retest structure
Target: Based on the next resistance or predefined risk-reward ratio
These prices are only an educational example, not a trade recommendation.
Bearish Breakdown Retest Example
The same concept works in the opposite direction.
Suppose a stock has strong support around ₹800.
Price repeatedly holds ₹800.
Eventually, price breaks below ₹800 and closes around ₹785.
Instead of immediately shorting, the trader waits for a possible retest.
Price later rises:
₹785 → ₹790 → ₹798 → ₹800
If price reaches the old support and gets rejected, ₹800 may now behave as resistance.
If bearish confirmation appears, a trader may consider a short setup.
The basic structure becomes:
Support → Breakdown → Retest → Rejection → Potential Short Entry
How to Identify a Strong Breakout
Not all breakouts deserve the same level of attention.
Here are some characteristics traders may consider.
1. Strong Price Movement
→ A breakout accompanied by strong momentum can be more convincing than a tiny move through the level.
However, extremely large candles can also create poor entries because price may already be extended.
2. Candle Close Beyond the Level
→ Instead of focusing only on the candle’s wick, pay attention to where the candle closes.
A candle that closes convincingly beyond resistance can provide more information than a candle that only briefly trades above it.
3. Volume Confirmation
→ Volume can provide additional context.
A breakout accompanied by noticeably higher volume may indicate increased participation.
However, volume should not be treated as a standalone buy or sell signal.
Always consider price structure as well.
4. Clear Market Structure
→ A breakout from a well-defined range or consolidation area can be easier to identify than a breakout from a messy chart.
The clearer the structure, the easier it can be to define the setup.
How to Identify a Good Retest
A good retest is not simply price touching the previous level.
Look for how price behaves there.
→ Bullish Retest
A potentially stronger bullish retest may show:
• Price returns toward former resistance
• Sellers fail to push price significantly lower
• Buyers appear around the level
• A bullish rejection candle develops
• Price starts forming a higher low
• Price moves back above the short-term structure
→ Bearish Retest
A potentially stronger bearish retest may show:
• Price returns toward former support
• Buyers fail to reclaim the level
• Sellers appear around the area
• A bearish rejection candle develops
• Price forms a lower high
• Price begins moving downward again
The important point is that the reaction around the level matters more than simply touching the level.
Where Should You Enter a Breakout Retest Trade?
There isn’t one universally correct entry point.
Different traders use different confirmation rules.
Entry Method 1: Confirmation Candle
→ Wait for a rejection or confirmation candle around the retest level.
For a bullish setup, the trader may enter after a bullish candle confirms the rejection.
For a bearish setup, the trader may enter after bearish confirmation.
Entry Method 2: Break of Confirmation Candle
→ Some traders wait for price to break the high of a bullish confirmation candle or the low of a bearish confirmation candle.
This provides another layer of confirmation but may result in a slightly later entry.
Entry Method 3: Aggressive Retest Entry
→ Some traders enter near the retest zone without waiting for strong confirmation.
This can provide an earlier entry but also increases the risk of entering a failed retest.
For beginners, having a clearly defined confirmation rule is generally easier to manage than making decisions based on emotions.
Where Should You Place the Stop-Loss?
Stop-loss placement should be based on the point where the trading idea becomes invalid.
For a bullish breakout retest, a trader might place the stop-loss below:
• The retest low
• The rejection structure
• A nearby swing low
For a bearish setup, the stop-loss might be above:
• The retest high
• The rejection structure
• A nearby swing high
Avoid placing a stop-loss at an arbitrary distance simply because the amount feels comfortable.
The market should determine the technical invalidation point, while your position size should determine how much money you are willing to risk.
Position Sizing Matters
A common beginner mistake is deciding position size first and stop-loss second.
A better approach is to determine the amount you are willing to risk and then calculate the position size.
For example, suppose:
Trading capital = ₹1,00,000
You decide to risk 1% on one trade.
Maximum planned risk:
₹1,00,000 × 1% = ₹1,000
If your stop-loss distance means you would lose ₹100 per share, the theoretical position size would be:
₹1,000 ÷ ₹100 = 10 shares
This is a simplified educational example. Actual trading costs, slippage, lot sizes, and instrument specifications should also be considered.
The key lesson is:
Risk should control position size, not the other way around.
How to Set Targets
There are several ways to determine a target.
1. Next Resistance or Support
→ For a bullish trade, the next major resistance area can become a potential target.
For a bearish trade, the next important support area may become a potential target.
2. Risk-Reward Ratio
→ Some traders define a minimum risk-reward requirement before entering.
For example:
If your planned risk is ₹500 and your potential reward is ₹1,000, the trade has a 1:2 risk-reward ratio.
The ratio alone does not make a trade profitable. Your strategy still needs a reasonable probability of success.
3. Measured Move
→ When a breakout occurs from a clearly defined range, some traders use the size of the range as a reference for a possible price objective.
This method should be backtested rather than blindly applied to every chart.
Breakout Retest Strategy Using Multiple Timeframes
Multiple-timeframe analysis can provide additional context.
For example:
Higher Timeframe
Use a higher timeframe to identify:
• Major support
• Major resistance
• Market structure
• Overall trend
• Lower Timeframe
Use a lower timeframe to identify:
• Breakout
• Retest
• Confirmation
• Entry trigger
For example, a trader could use the daily chart to identify a major resistance level and then use a lower timeframe to observe the breakout and retest.
However, using more timeframes does not automatically make analysis better.
Too many timeframes can create confusion.
Choose a simple process that you can consistently follow.
Breakout Retest in Trending Markets
The strategy can work particularly well when the breakout aligns with an established trend.
For example, in an uptrend:
Higher highs → Higher lows → Resistance breakout → Retest → Continuation
In a downtrend:
Lower lows → Lower highs → Support breakdown → Retest → Continuation
The trend can provide additional context, but it does not guarantee that the trade will succeed.
Breakout Retest in a Sideways Market
Sideways markets can create many false breakouts.
Price may repeatedly move outside a range and then return inside it.
This is why traders should pay close attention to:
• Range size
• Volume
• Breakout strength
• Candle closes
• Retest behaviour
• Broader market conditions
A breakout from a very narrow and noisy range may require more confirmation than a clean breakout from a well-established structure.
Common Breakout Retest Mistakes
Understanding what not to do is just as important as learning the strategy.
Mistake 1: Buying Every Breakout
→ A breakout does not automatically mean price will continue higher.
Better approach: Define what makes a breakout valid before entering.
Mistake 2: Chasing Price
→ After seeing a large bullish candle, beginners often enter because they fear missing the move.
This is commonly called FOMO — fear of missing out.
Better approach: Follow your setup instead of chasing price.
Mistake 3: Treating Every Touch as a Retest
→ Price touching the old level does not mean the retest has succeeded.
Better approach: Watch the reaction around the level.
Mistake 4: Ignoring the Overall Market
→ A stock can show a bullish breakout while the broader market is under heavy selling pressure.
This does not automatically invalidate the trade, but it is useful context.
Mistake 5: Using a Very Tight Stop-Loss
→ A stop-loss placed too close to the entry may be triggered by normal market noise.
Better approach: Place the stop where the trade idea becomes invalid and adjust position size accordingly.
Mistake 6: Moving the Stop-Loss After Entry
→ Some traders move their stop farther away when price moves against them.
This can turn a planned small loss into a much larger loss.
Better approach: Decide your maximum risk before entering.
Mistake 7: Increasing Position Size After a Loss
→ Trying to recover a previous loss with a larger trade can lead to emotional decision-making.
Better approach: Treat every trade independently and follow your risk rules.
Breakout Retest Checklist for Beginners
Before taking a trade, ask yourself:
• [ ] Is there a clearly identifiable support or resistance level?
• [ ] Did price actually break the level?
• [ ] Did the breakout close beyond the level?
• [ ] Has price returned for a retest?
• [ ] Is there confirmation at the retest?
• [ ] Is the market environment suitable for the setup?
• [ ] Where is the trade invalidated?
• [ ] Is the stop-loss technically logical?
• [ ] Does the potential reward justify the risk?
• [ ] Is my position size appropriate?
• [ ] Am I entering because of my plan rather than FOMO?
If several answers are unclear, waiting can be better than forcing a trade.
Can the Breakout Retest Strategy Be Used for Intraday Trading?
Yes, traders can use breakout-retest concepts for intraday trading.
For example, traders may monitor:
• Nifty 50
• Bank Nifty
• Individual stocks
• Sector indices
• Futures
• Other liquid instruments
The exact setup depends on the timeframe and instrument.
Intraday traders should also consider:
• Market opening volatility
• Liquidity
• Bid-ask spread
• Slippage
Important economic or company news
Trading costs
A strategy that appears successful on a chart may perform differently in live trading.
Can You Use Indicators With a Breakout Retest?
Yes, indicators can be used as supporting evidence, but they should not replace price structure.
Some traders use:
Volume
→ To evaluate participation during the breakout.
VWAP
→ Useful for intraday traders who want to understand price relative to the volume-weighted average.
Moving Averages
→ Can provide trend context.
RSI
→ May help identify momentum conditions.
MACD
→ Can provide additional momentum information.
However, adding more indicators does not necessarily improve a strategy.
A chart full of indicators can actually make decision-making harder.
Start with price structure and add only tools that have a clear purpose.
How to Backtest the Breakout Retest Strategy
Before risking real money, consider testing the strategy on historical data.
Create clear rules.
For example:
Market: Selected liquid stocks
Timeframe: 15-minute
Breakout: Candle closes above resistance
Retest: Price returns within a predefined distance of the level
Confirmation: Bullish rejection candle
Stop-loss: Below retest swing low
Target: 2R
Risk: 1% per trade
Then test a meaningful sample of trades.
Record:
• Number of trades
• Winning trades
• Losing trades
• Average win
• Average loss
• Maximum losing streak
• Maximum drawdown
• Profit factor
• Expectancy
Do not change the rules after every losing trade.
The purpose of backtesting is to understand how the complete system performs, not to make historical results look perfect.
A Simple Trading Journal for This Strategy
After every trade, record:
Date:
Instrument:
Timeframe:
Market condition:
Breakout level:
Entry price:
Stop-loss:
Target:
Risk:
Result:
Reason for entry:
Confirmation used:
Mistake, if any:
Lesson learned:
After 30, 50, or 100 trades, review your results.
You may discover patterns that are difficult to notice from individual trades.
For example, you might find that your setup performs better during trending markets than during sideways conditions.
That information can help you refine your rules.
Is the Breakout Retest Strategy Profitable?
It can be profitable for some traders, but there is no guarantee.
A strategy’s profitability depends on several factors:
• Entry rules
• Exit rules
• Win rate
• Average win
• Average loss
• Trading costs
• Slippage
• Market conditions
• Risk management
• Trader discipline
For example, a strategy does not necessarily need a very high win rate if its average winning trades are sufficiently larger than its average losing trades.
This is why traders should evaluate expectancy and drawdown, rather than judging a strategy only by its win rate.
Final Thoughts
The breakout retest strategy is based on a simple idea: don’t blindly chase the breakout; wait to see whether the broken level can successfully change its role.
For a bullish setup, resistance may become support.
For a bearish setup, support may become resistance.
The most important part is not simply identifying a breakout. It is having a complete trading plan covering:
Level → Breakout → Retest → Confirmation → Entry → Stop-Loss → Target → Position Size
Beginners should first learn to identify clean market structures and practice the setup on historical charts or a suitable paper-trading environment.
Most importantly, remember that a strategy is only one part of trading. Risk management, discipline, consistency, and realistic expectations are equally important.
Do not risk money you cannot afford to lose, and never assume that a historical or hypothetical example represents future trading results.
Breakout Retest Strategy Explained
Frequently Asked Questions
What is a breakout retest strategy?
→ A breakout retest strategy involves waiting for price to break an important support or resistance level and then return to test that level before looking for a potential continuation trade.
Is a retest necessary for every breakout?
→ No. Some breakouts continue immediately without retesting. Waiting for a retest can provide additional confirmation, but it can also cause traders to miss fast-moving opportunities.
What is the difference between a breakout and a retest?
→ A breakout occurs when price moves beyond an important support or resistance level. A retest occurs when price later returns toward the broken level to test whether it will hold in its new role.
Where should I put my stop-loss?
→ The stop-loss should generally be placed at a logical point where the trade idea becomes invalid, rather than at an arbitrary price distance. Position size should then be adjusted according to your planned risk.
Can beginners use the breakout retest strategy?
→ Beginners can study and practice the strategy, but they should understand its risks first. Paper trading and historical backtesting can be useful before risking real capital.
Does the breakout retest strategy work in all markets?
→ No strategy works equally well in every market condition. Breakout-retest setups can behave differently during strong trends, sideways markets, high-volatility periods, and news-driven sessions.
Which timeframe is best for breakout retests?
→ There is no single best timeframe. Higher timeframes may provide stronger structural levels, while lower timeframes can provide more trading opportunities. Choose a timeframe that matches your trading style and test it before using real money.
Breakout Retest Strategy Explained
Risk Disclaimer
This article is for educational and informational purposes only. It is not investment advice, financial advice, or a recommendation to buy or sell any security, derivative, or other financial instrument.
Trading involves substantial risk, and you can lose part or all of your trading capital. Past performance, backtesting results, or hypothetical examples do not guarantee future results. Always conduct your own research and consider consulting a qualified financial professional if you need personalized financial advice.
JD Trading Zone focuses on trading education and does not guarantee profits or trading success.
Pingback: Volume and Price Action Trading Strategy - jdtradingzone.com
Now adding this site to a small mental group of recommendations I keep ready for specific kinds of inquiries, and a stop at blog44hang extended the recommendation readiness, content that I can confidently point friends and colleagues toward in specific contexts is content with real social utility and this site has that utility clearly.
Reading this with my morning coffee turned into reading the related posts with my morning coffee, and a stop at visionaryvista stretched the morning further, content that pulls breakfast into a reading session rather than just accompanying it is content that has earned a higher claim on my attention than the average article does.
Pingback: How to Choose Stocks for Intraday Trading in India - jdtradingzone
Pingback: Opening Range Breakout Strategy: A Practical Guide for Intraday Traders in India - jdtradingzone
Pingback: Why Good Trading Setups Fail: 9 Reasons Behind Losing Trades - jdtradingzone