
It’s important to know about Fake Breakouts and Real Breakouts, including practical tips, confirmation methods, and common mistakes.
Welcome to JD Trading Zone
Breakout trading is one of the most popular strategies in the stock market. Many traders wait patiently for the price to break above resistance or below support, expecting a strong move afterward.
However, not every breakout leads to a profitable trade.
Sometimes the price breaks through an important level, attracts buyers or sellers, and then suddenly reverses direction. This is known as a fake breakout or false breakout.
Learning to identify the difference between a fake breakout and a real breakout can help you avoid unnecessary losses and improve your trading performance.
Also check:- (How to Trade Breakouts Successfully) (Best Candlestick Patterns for Intraday Trading) (100 Stock Market Terms Every Beginner Should Know) (Common Chart Patterns Every Trader Must Know) (How to Analyze Volume in the Stock Market Like a Pro)
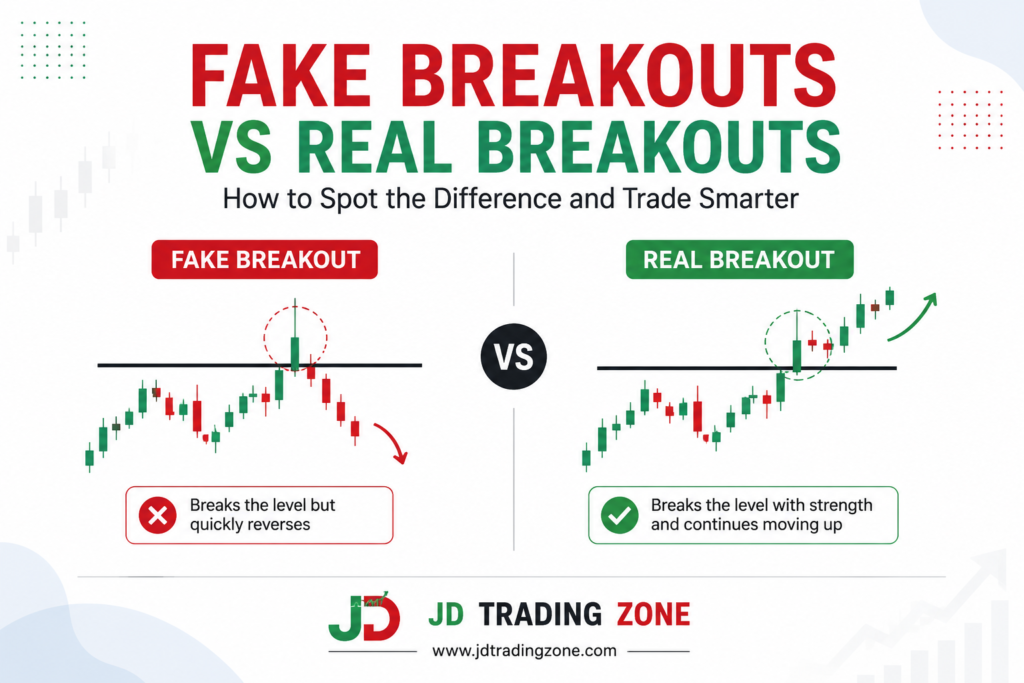
Fake Breakouts vs Real Breakouts
What Is a Breakout?
A breakout happens when the price moves beyond an important support or resistance level with enough momentum to start a new trend.
For example:
• A stock trading below ₹500 for several weeks finally moves above ₹500.
• If buyers continue pushing the price higher, it becomes a bullish breakout.
• If sellers break an important support level and the price keeps falling, it becomes a bearish breakout.
Breakouts often occur after periods of consolidation or sideways movement.
What Is a Real Breakout?
A real breakout occurs when the price breaks an important level and continues moving in the breakout direction with strong buying or selling pressure.
Characteristics of a real breakout include:
• Strong momentum
• Higher trading volume
• Closing above resistance (or below support)
• Follow-through movement in the next few candles
• Buyers or sellers remain in control
Example:
Resistance: ₹100
Price moves from ₹99 to ₹102 with very high volume.
The next few candles continue moving toward ₹105, ₹108, and ₹110.
This is a genuine breakout.
What Is a Fake Breakout?
A fake breakout happens when price briefly crosses support or resistance but quickly reverses.
Many beginners enter the trade immediately after seeing the breakout, only to watch the market reverse against them.
Fake breakouts are common because:
• Large institutions trap retail traders.
• There isn’t enough buying or selling pressure.
• The breakout lacks volume.
• News creates temporary volatility.
Real Breakout vs Fake Breakout
Feature
• Volume
• Price Action
• Candle Close
• Momentum
• Follow-through
Real Breakout
• High
• Strong continuation
• Closes beyond breakout level
• Strong
• Yes
Fake Breakout
• Low or average
• Quick reversal
• Closes back inside the range
• Weak
• No
Why Do Fake Breakouts Happen?
Several factors can create false breakouts.
1. Low Trading Volume
Without sufficient volume, a breakout lacks strength.
Volume acts as confirmation that many traders support the move.
2. Stop-Loss Hunting
Large market participants know many traders place stop-loss orders near support and resistance.
Price may briefly cross these levels, trigger stop-losses, and then reverse.
3. News-Based Volatility
Unexpected news can create sharp price movements that disappear once emotions settle.
4. Weak Market Trend
Even a good breakout has a lower chance of succeeding if the overall market trend is weak.
Always check the broader market before trading individual stocks.
How to Identify a Real Breakout
→ Wait for the Candle to Close
Never enter simply because price moved above resistance.
Wait for the candle to close.
Many fake breakouts disappear before the candle closes.
→ Check Trading Volume
One of the strongest confirmations is increased volume.
A breakout with significantly higher volume is generally more reliable.
→ Look for Momentum
Strong candles with little hesitation often indicate genuine buying or selling interest.
Small candles with long wicks may suggest uncertainty.
→ Confirm With Retest
Sometimes price breaks resistance and later returns to test it.
If the old resistance becomes new support and buyers step in again, the breakout becomes stronger.
→ Follow the Overall Trend
Breakouts that occur in the direction of the primary trend generally have higher success rates.
For example:
• Uptrend → Buy bullish breakouts.
• Downtrend → Sell bearish breakdowns.
Signs of a Fake Breakout
Watch for these warning signals:
• Very low trading volume
• Long upper or lower candle wicks
• Price quickly returns inside the previous range
• No follow-through candles
• Breakout occurs during low liquidity
• Market sentiment does not support the move
If several of these signs appear together, it’s better to wait.
Common Beginner Mistakes
→ Entering Too Early
Many traders buy as soon as price touches resistance.
Patience often leads to better entries.
→ Ignoring Volume
Price alone tells only part of the story.
Volume confirms whether institutions are participating.
→ Trading Every Breakout
Not every breakout deserves a trade.
Focus only on high-quality setups.
→ No Stop-Loss
Even the best breakout can fail.
Always define your risk before entering.
→ Chasing Large Candles
Buying after an oversized breakout candle often means entering late.
Wait for a better risk-to-reward opportunity.
Indicators That Can Help Confirm Breakouts
While price action should remain the primary focus, these indicators can provide additional confirmation.
→ Volume Indicator
The most important confirmation tool for breakout trading.
→ VWAP
Useful for intraday traders to identify institutional participation.
→ Moving Averages
Can help confirm the overall trend direction.
→ RSI
Shows whether momentum supports the breakout.
Remember, indicators should confirm your analysis—not replace it.
A Simple Breakout Trading Checklist
Before entering any breakout trade, ask yourself:
• Is the breakout above a strong resistance or below a strong support?
• Has the candle closed beyond the level?
• Is trading volume higher than average?
• Does the overall market support the trade?
• Is the risk-to-reward ratio favorable?
• Have you planned your stop-loss?
• Are you following your trading plan?
If most answers are “Yes,” the setup is generally stronger.
Risk Management Tips
Even experienced traders encounter fake breakouts.
Protect yourself by:
• Risking only a small percentage of your capital per trade.
• Using stop-loss orders.
• Avoiding emotional decisions.
• Waiting for confirmation instead of guessing.
• Maintaining a trading journal to review breakout trades.
Consistent risk management is more important than finding the perfect entry.
Frequently Asked Questions (FAQs)
Are fake breakouts common?
→ Yes. False breakouts occur regularly in all financial markets and timeframes.
Can volume confirm a breakout?
Higher-than-average volume increases the probability that a breakout is genuine.
Should beginners trade every breakout?
→ No. Beginners should focus only on well-confirmed breakouts with strong volume and proper risk management.
Which timeframe works best for breakout trading?
→ It depends on your trading style. Intraday traders often use lower timeframes, while swing traders prefer higher timeframes for more reliable signals.
Can indicators completely prevent fake breakouts?
→ No. Indicators improve decision-making but cannot eliminate false signals. Combining price action, volume, trend analysis, and risk management is more effective.
Fake Breakouts vs Real Breakouts
Final takeaway
Every trader experiences fake breakouts. They are a natural part of the market and cannot be completely avoided.
The goal isn’t to predict every breakout correctly—it’s to increase the probability of trading genuine opportunities while managing risk when the market proves you wrong.
By waiting for candle closes, confirming with volume, respecting the overall trend, and following disciplined risk management, beginners can significantly reduce the chances of getting trapped by false breakouts.
Remember, successful trading is about consistency, patience, and protecting your capital rather than chasing every market move.
Pingback: Volume Price Analysis (VPA) for Beginners - jdtradingzone.com
Pingback: VWAP Trading Strategy Step by Step - jdtradingzone