
Today we will discuss and will learn how to use the VWAP trading strategy step by step, understand why it works, and avoid common beginner mistakes.
Welcome to JD Trading Zone
The Volume Weighted Average Price (VWAP) is one of the most trusted indicators used by professional traders, institutions, and retail investors. It combines both price and trading volume to show the average price at which a stock has traded throughout the day.
Unlike many indicators that only use price,
VWAP also considers volume, making it a valuable tool for identifying trends, support and resistance levels, and high-probability trading opportunities.
Also check:- (Volume Price Analysis (VPA) for Beginners) (Fake Breakouts vs Real Breakouts) (How to Trade Breakouts Successfully) (Best Candlestick Patterns for Intraday Trading) (100 Stock Market Terms Every Beginner Should Know)
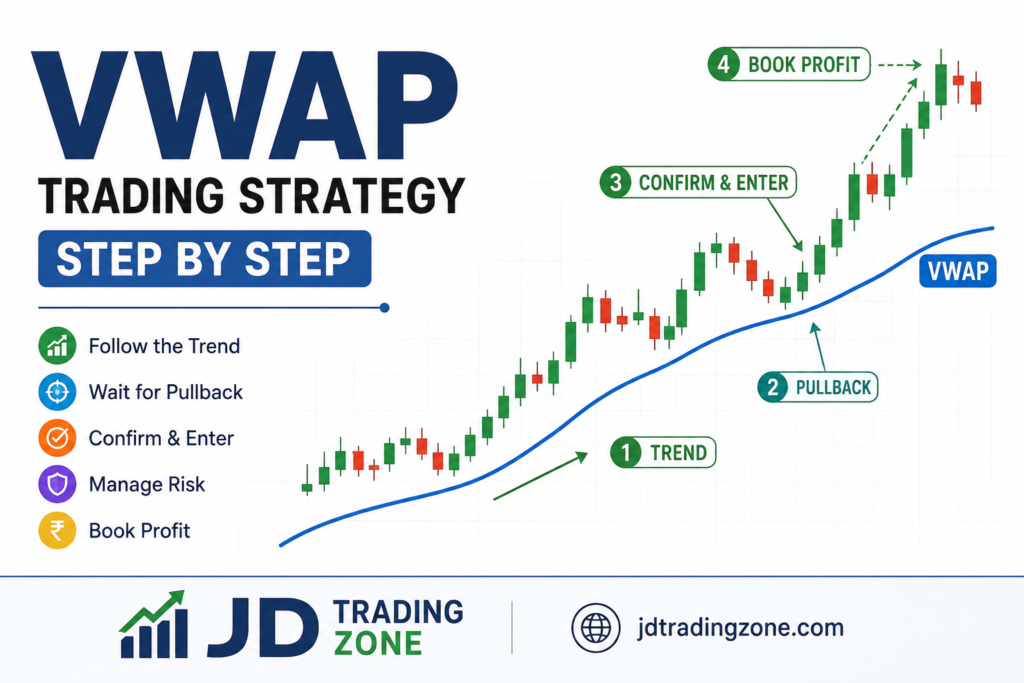
VWAP Trading Strategy Step by Step
What is VWAP?
VWAP stands for Volume Weighted Average Price.
It calculates the average trading price of a stock based on both price and volume from the market open until the current time.
Simple meaning
• Price above VWAP generally indicates buyers are in control.
• Price below VWAP generally indicates sellers are stronger.
• VWAP often acts as dynamic support and resistance during intraday trading.
Since institutional traders monitor VWAP closely, many price reactions happen around this level.
VWAP helps traders:
• Identify the market trend
• Find better entry points
• Avoid buying at expensive prices
• Avoid selling at weak prices
• Confirm breakout trades
• Improve trade timing
Many professional intraday traders use VWAP every trading day.
Best Timeframe for VWAP
VWAP is mainly designed for intraday trading.
Recommended chart timeframes:
• 1-Minute Chart
• 3-Minute Chart
• 5-Minute Chart
• 15-Minute Chart
The 5-minute chart offers a good balance between fewer false signals and enough trading opportunities.
Step-by-Step VWAP Trading Strategy
Step 1: Wait for the Market to Open
Do not enter a trade immediately after the opening bell.
The first 10–15 minutes are often highly volatile.
Allow the market to settle before making trading decisions.
Step 2: Identify the Trend
Observe where the price is trading relative to VWAP.
→ Bullish Trend
• Price stays above VWAP
• Higher highs and higher lows form
• Buying pressure is visible
→ Bearish Trend
• Price remains below VWAP
• Lower highs and lower lows form
• Selling pressure dominates
Only trade in the direction of the overall trend.
Step 3: Wait for a Pullback
Avoid chasing price.
Instead, wait for the price to return near VWAP.
This provides a better risk-to-reward ratio.
Step 4: Look for Confirmation
Never enter simply because price touches VWAP.
Wait for confirmation such as:
• Strong bullish candle
• Strong bearish candle
• Increase in trading volume
• Break of a minor resistance or support
• Higher high after the pullback
Confirmation reduces false signals.
Step 5: Enter the Trade
→ Buy Entry
• Price above VWAP
• Pullback near VWAP
• Bullish confirmation candle
• Volume increases
→ Sell Entry
• Price below VWAP
• Pullback towards VWAP
• Bearish confirmation candle
• Selling volume increases
Patience is often more profitable than entering early.
Step 6: Place Stop Loss
Always use a stop loss.
→ For Buy Trades:
Place the stop loss below:
• Recent swing low
• VWAP (if appropriate)
→ For Sell Trades:
Place the stop loss above:
• Recent swing high
• VWAP
Never trade without predefined risk.
Step 7: Book Profit
Possible exit methods:
• Next resistance level
• Next support level
• Risk-to-reward ratio of 1:2 or 1:3
• Trailing stop loss
• Exit when price decisively crosses VWAP against your position
Have an exit plan before entering the trade.
Example of a Buy Trade
Imagine a stock opens at ₹500.
• Price rises above VWAP.
• It pulls back to VWAP.
• A bullish engulfing candle forms with higher volume.
• You enter after the confirmation candle closes.
• Stop loss is placed below the recent swing low.
• Price continues upward, and you exit near the next resistance.
This follows the strategy with discipline instead of emotion.
Example of a Sell Trade
Suppose a stock opens weak.
• Price stays below VWAP.
• It rallies back towards VWAP.
• A bearish rejection candle forms.
• Selling volume increases.
• You enter a short trade.
• Stop loss is placed above the swing high.
• Price resumes its downward trend.
Risk Management Rules
A profitable strategy requires proper risk management.
Follow these rules:
• Risk only 1–2% of your trading capital per trade.
• Avoid revenge trading after a loss.
• Do not overtrade.
• Maintain a trading journal.
• Never move your stop loss further away to avoid a loss.
• Trade only when your setup is confirmed.
Risk management is often more important than finding perfect entries.
Common VWAP Trading Mistakes
Many beginners make these mistakes:
→ Trading Against the Trend
Always follow the dominant trend.
→ Entering Too Early
Wait for confirmation before entering.
→ Ignoring Volume
VWAP works best when volume supports the move.
→ Chasing Breakouts
Wait for pullbacks instead of buying at the highest price.
→ No Stop Loss
One large loss can erase the profits from many successful trades.
Advantages of the VWAP Strategy
• Easy to understand
• Suitable for beginners
• Works well in trending markets
• Used by institutional traders
• Helps improve trade timing
• Can reduce emotional decisions
Limitations of VWAP
No indicator is perfect.
VWAP may perform poorly when:
• The market is moving sideways.
• Volume is unusually low.
• Major news events create extreme volatility.
• Traders rely only on VWAP without price action confirmation.
Combining VWAP with candlestick patterns, support and resistance, or volume analysis often improves decision-making.
Best Indicators to Combine with VWAP
Many traders combine VWAP with:
• Volume Analysis
• Price Action
• Support and Resistance
• 20 EMA
• 50 EMA
• RSI
• MACD
Using too many indicators can create confusion, so keep your chart simple.
Who Should Use This Strategy?
This strategy is suitable for:
• Beginners learning intraday trading
• Swing traders using intraday entries
• Options traders
• Equity traders
• Futures traders
It is especially effective when combined with disciplined risk management.
Frequently Asked Questions
Is VWAP good for beginners?
→ Yes. VWAP is one of the easiest indicators to understand and can help beginners identify the overall intraday trend.
Can VWAP predict future prices?
→ No. VWAP is not a prediction tool. It helps traders understand the current market structure and identify high-probability setups.
Which timeframe is best for VWAP?
→ The 5-minute chart is widely preferred by intraday traders because it balances signal quality and trading opportunities.
Can I use VWAP alone?
→ While possible, combining VWAP with price action and volume confirmation generally produces more reliable trading decisions.
VWAP Trading Strategy Step by Step
The VWAP trading strategy is simple, practical, and widely used by both retail and institutional traders. However, success does not come from using the indicator alone. Consistent profits require patience, discipline, proper risk management, and continuous practice.
Focus on trading with the trend, wait for confirmation before entering, and always protect your capital with a stop loss. Over time, combining these habits with the VWAP strategy can help you become a more confident and disciplined trader.
Disclaimer: This article is for educational purposes only and should not be considered financial or investment advice. Trading involves risk, and past performance does not guarantee future results. Always do your own research before making investment decisions.
mostbet bónusz aktiválása befizetéskor https://mostbet85803.icu/
Pingback: EMA Crossover Strategy Explained - jdtradingzone.com
Pingback: Opening Range Breakout Strategy - jdtradingzone