
In this guide, you’ll learn What is support and resistance? Complete beginner guide in simple language.
Welcome JD Trading Zone
If you are new to the stock market, you have probably heard traders talking about support and resistance. These are two of the most important concepts in technical analysis.
Understanding support and resistance can help you:
• Find better entry and exit points.
• Reduce emotional trading.
• Improve your risk management.
• Understand why prices often reverse at certain levels.
The best part is that you don’t need expensive software or complex indicators to use them. Even beginners can learn these concepts with practice.
Also check:- (Best Indicators for Intraday Trading in India) (How to Read Candlestick Charts for Beginners) (Complete beginners guidance about the stock market) (How to Use Pre-Market Data for Better Intraday Trades) (VWAP with RSI Strategy for More Accurate Trades)
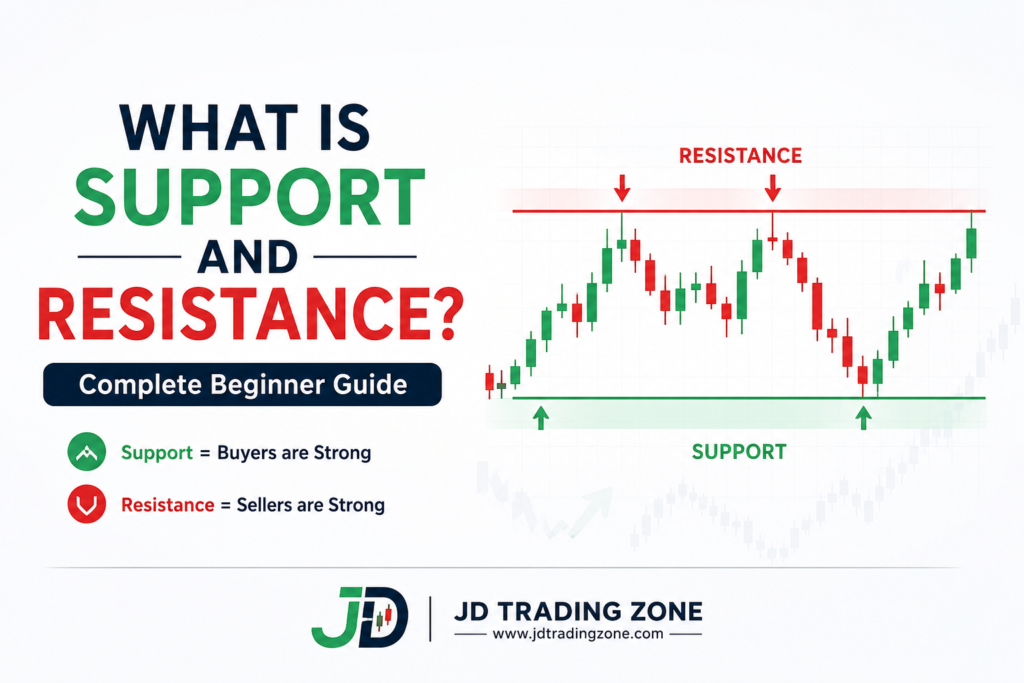
What Is Support and Resistance? beginner guide
What Is Support?
Support is a price level where a falling stock often stops declining because buyers become more active than sellers.
Think of support as the floor of a room.
When a ball falls onto the floor, it usually bounces upward. Similarly, when a stock reaches a strong support level, buyers may step in and push the price higher.
Example
Suppose a stock falls several times near ₹500 and then moves upward each time.
This means ₹500 is acting as a support level.
What Is Resistance?
Resistance is a price level where a rising stock often stops moving higher because sellers become more active than buyers.
Think of resistance as the ceiling of a room.
When you throw a ball upward, it hits the ceiling and falls back.
Likewise, when a stock reaches resistance, selling pressure may increase and the price may move downward.
Example
If a stock repeatedly reaches ₹700 and falls from there, then ₹700 is acting as resistance.
Why Do Support and Resistance Work?
Support and resistance exist because of buyer and seller psychology.
At support:
• Buyers believe the stock is available at a good price.
• Demand increases.
• Selling pressure decreases.
At resistance:
• Many traders book profits.
• Sellers believe the stock is expensive.
• Supply increases.
Because many traders watch these levels, they often become self-fulfilling.
Simple Example
Imagine a stock trading between ₹200 and ₹250.
• ₹200 acts as support.
• ₹250 acts as resistance.
The stock may continue moving between these two levels until a strong breakout or breakdown occurs.
How to Identify Support and Resistance
1. Previous Swing Highs and Lows
The easiest method is to look at previous turning points.
• Previous lows often become support.
• Previous highs often become resistance.
This is the first method every beginner should learn.
2. Multiple Price Rejections
A level becomes stronger when price reacts there multiple times.
For example:
• One bounce = weak support.
• Three or four successful bounces = stronger support.
The more times a level is respected without breaking, the more attention traders give it.
3. Round Numbers
Round numbers often act as psychological levels.
Examples:
• ₹100
• ₹500
• ₹1000
• ₹2000
Many traders place buy or sell orders around these prices.
4. Moving Averages
Popular moving averages such as:
• 20 EMA
• 50 EMA
• 200 EMA
can sometimes act as dynamic support and resistance.
Unlike horizontal levels, these move with price over time.
5. Trendlines
In an uptrend, the trendline may act as support.
In a downtrend, the trendline may act as resistance.
Types of Support and Resistance
→ Horizontal Support and Resistance
These are fixed price levels where the market has reversed before.
Example: Support: ₹300
Resistance: ₹340
→ Dynamic Support and Resistance
These levels move with price.
Examples include:
• VWAP
• EMA
• SMA
• Trendlines
What Is a Breakout?
A breakout happens when price moves above resistance with strong buying volume.
This may indicate that buyers have gained control.
Example: Resistance = ₹600
Price closes at ₹615 with high volume.
This is called a bullish breakout.
What Is a Breakdown?
A breakdown happens when price falls below support with strong selling pressure.
Example: Support = ₹450
Price closes at ₹440 with high volume.
This may indicate further weakness.
Role of Volume
Volume is important when analysing support and resistance.
Strong Breakout
• High volume
• Large candles
• Strong momentum
Weak Breakout
• Low volume
• Small candles
• Higher chance of failure
Always try to confirm breakouts using volume instead of relying only on price.
Support Becomes Resistance
One interesting rule in technical analysis is:
Broken support often becomes new resistance.
Example:
Support = ₹400
Price falls below ₹400.
Later, price rises back to ₹400 but gets rejected.
Now ₹400 acts as resistance.
Resistance Becomes Support
The opposite is also true.
Example:
Resistance = ₹700
Price breaks above ₹700.
Later, price falls back to ₹700 and bounces.
Now ₹700 becomes support.
Best Timeframes for Beginners
Different traders use different chart timeframes.
Intraday Traders
• 5-minute chart
• 15-minute chart
Swing Traders
• Daily chart
• 4-hour chart
Long-Term Investors
• Weekly chart
• Monthly chart
Higher timeframes generally provide stronger support and resistance levels.
Common Beginner Mistakes
→ Drawing Too Many Lines
Only mark important levels.
Too many lines make charts confusing.
→ Ignoring Volume
A breakout without volume is often unreliable.
→ Treating Levels as Exact Prices
Support and resistance are usually zones, not exact numbers.
For example:
Support may exist between ₹495 and ₹502 instead of exactly ₹500.
→ Trading Every Bounce
Not every support or resistance level leads to a successful trade.
Wait for confirmation such as:
• Bullish candlestick patterns
• Bearish candlestick patterns
• Strong volume
• Trend confirmation
→ Ignoring Risk Management
Even the strongest support can fail.
Always use a stop-loss and risk only a small portion of your trading capital on a single trade.
Simple Trading Example
Imagine a stock trading at ₹980.
You notice:
• Support = ₹950
• Resistance = ₹1020
Possible plan:
• Wait for price near ₹950.
• Look for a bullish candlestick.
• Enter only after confirmation.
• Keep stop-loss below support.
• Aim for resistance as the first target.
This is a simple example for learning purposes, not a guaranteed strategy.
Advantages of Support and Resistance
• Easy to learn.
• Works in stocks, indices, forex and commodities.
• Helps identify entry and exit points.
• Improves stop-loss placement.
• Can be combined with indicators like VWAP, RSI and moving averages.
• Suitable for beginners.
Limitations
• No level works 100% of the time.
• False breakouts can occur.
• Requires patience and practice.
• Market news can invalidate technical levels.
Tips for Beginners
• Practice on historical charts before trading with real money.
• Focus on higher timeframes first.
• Combine support and resistance with volume analysis.
• Don’t chase breakouts without confirmation.
• Maintain a trading journal to review your decisions.
• Follow proper risk management on every trade.
Frequently Asked Questions (FAQs)
Is support and resistance enough for trading?
→ Support and resistance are powerful tools, but they work best when combined with price action, volume, trend analysis, and disciplined risk management.
Which timeframe gives the strongest support and resistance?
→ Daily and weekly charts usually provide stronger levels than very short-term charts.
Can beginners learn support and resistance easily?
→ Yes. It is one of the simplest and most useful concepts in technical analysis, making it an excellent starting point for new traders.
Do support and resistance work in intraday trading?
→ Yes. Intraday traders frequently use these levels to identify potential entries, exits, and stop-loss placements.
Can support become resistance?
→ Yes. When a support level breaks, it often acts as resistance if the price later revisits that level.
What is support and resistance? complete beginner guide
Final Thoughts
Support and resistance form the foundation of technical analysis. They help traders understand where buyers and sellers are likely to become active, making it easier to plan trades instead of reacting emotionally.
As a beginner, don’t aim to predict every market move. Focus on learning how price behaves around important levels, wait for confirmation before entering trades, and always protect your capital with proper risk management. With consistent practice, support and resistance can become one of the most valuable tools in your trading journey.
Pingback: Price action trading explained learn without indicator - jdtradingzone.com
Pingback: Best Time Frame for Intraday Trading - jdtradingzone
Pingback: Top 10 mistakes new traders make and how to avoid them - jdtradingzone