
In this beginner-friendly guide, you’ll learn what candlestick charts are, how to read Candlestick Charts for Beginners, the meaning of bullish and bearish candles, the most useful candlestick patterns, common mistakes beginners make, and practical tips to improve your chart-reading skills.
Welcome to JD Trading Zone
If you’re new to the stock market, one of the first skills you should learn is how to read candlestick charts. Every professional trader uses candlestick charts because they provide valuable information about price movement, market sentiment, and possible trading opportunities.
The good news is that candlestick charts are much easier to understand than they appear. Once you know what each candle represents, you can begin analysing price action with confidence.
Also check:- (Complete beginners guidance about the stock market) (How to Use Pre-Market Data for Better Intraday Trades) (VWAP with RSI Strategy for More Accurate Trades) (10 Risk Management Rules Every Trader Must Know)
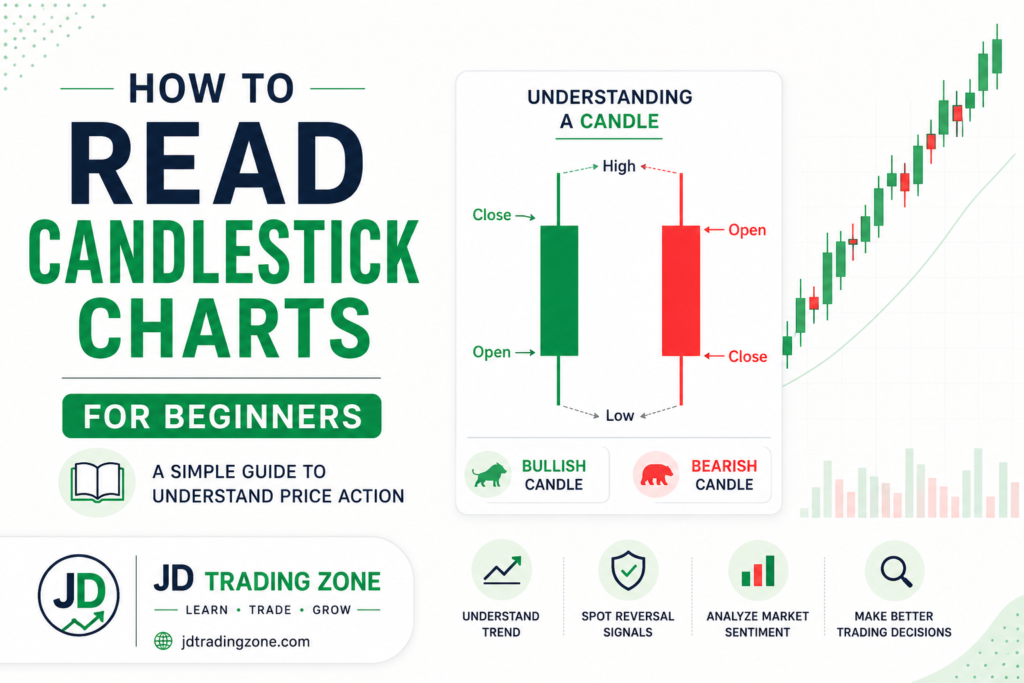
How to Read Candlestick Charts for Beginners
What Is a Candlestick Chart?
A candlestick chart is a price chart that shows how the price of a stock, index, or other financial asset moves during a specific period.
Each candlestick displays four important prices:
• Opening Price
• Highest Price
• Lowest Price
• Closing Price
This information helps traders understand who was stronger during that period—buyers or sellers.
Why Are Candlestick Charts Important?
Candlestick charts help traders:
• Understand market sentiment
• Identify buying and selling pressure
• Spot potential trend reversals
• Find trend continuation opportunities
• Improve trade timing
• Analyse price action without relying on many indicators
This is why candlestick charts are used in intraday trading, swing trading, positional trading, and even long-term investing.
Anatomy of a Candlestick
Every candlestick has two main parts.
→ 1. Real Body
The body represents the difference between the opening and closing prices.
A large body indicates strong buying or selling pressure.
A small body indicates market indecision.
→ 2. Wicks (Shadows)
The thin lines above and below the body are called wicks or shadows.
• Upper wick = Highest price reached
• Lower wick = Lowest price reached
Long wicks often indicate rejection of higher or lower prices.
Bullish vs Bearish Candles
→ Bullish Candle
A bullish candle forms when the closing price is higher than the opening price.
It shows buyers were stronger than sellers during that period.
Usually displayed as:
• Green
• White
→ Bearish Candle
A bearish candle forms when the closing price is lower than the opening price.
It shows sellers controlled the market.
Usually displayed as:
• Red
• Black
Understanding the Four Prices
Imagine a stock trades like this:
• Opening Price: ₹500
• Highest Price: ₹520
• Lowest Price: ₹495
• Closing Price: ₹518
From this candle you can understand:
• Buyers pushed prices higher.
• Sellers attempted to bring prices down.
• Buyers still managed to close near the day’s high.
• Overall sentiment was bullish.
Reading these four prices helps you understand the battle between buyers and sellers.
How to Read Candlestick Charts Step by Step
→ Step 1: Identify the Trend
Before analysing any candle, determine whether the market is:
• Uptrend
• Downtrend
• Sideways
Trading with the overall trend generally offers higher-probability opportunities.
→ Step 2: Look at Candle Size
Large candles usually indicate strong momentum.
Small candles suggest uncertainty or low volatility.
→ Step 3: Observe the Wicks
Long upper wick:
Shows sellers rejected higher prices.
Long lower wick:
Shows buyers rejected lower prices.
→ Step 4: Watch Consecutive Candles
Never judge the market based on one candle alone.
Instead, analyse a series of candles to understand the overall market behaviour.
→ Step 5: Check Support and Resistance
Candlestick signals become more reliable when they appear near:
• Support levels
• Resistance levels
• Trendlines
• Previous swing highs and lows
Most Important Candlestick Patterns for Beginners
1. Doji
A Doji has a very small body.
It indicates indecision between buyers and sellers.
After a strong trend, it may signal a possible reversal.
2. Hammer
The Hammer has:
• Small body
• Long lower shadow
Usually appears after a downtrend.
It may suggest buyers are returning.
3. Shooting Star
Appears after an uptrend.
Features:
• Small body
• Long upper wick
It indicates sellers rejected higher prices.
4. Bullish Engulfing
A large bullish candle completely covers the previous bearish candle.
Often signals strong buying momentum.
5. Bearish Engulfing
A large bearish candle completely covers the previous bullish candle.
Often indicates increasing selling pressure.
What Candlestick Charts Reveal
Candlestick charts help answer questions like:
• Are buyers gaining strength?
• Are sellers taking control?
• Is the trend weakening?
• Is momentum increasing?
• Is a reversal possible?
• Is the market consolidating?
Learning to answer these questions is more valuable than memorising dozens of patterns.
Best Timeframes for Beginners
If you’re just starting:
→ Long-Term Investors
• Daily Chart
• Weekly Chart
→ Swing Traders
• Daily Chart
• 4-Hour Chart
→ Intraday Traders
• 15-Minute Chart
• 5-Minute Chart
Avoid switching between too many timeframes, as it can create confusion.
Common Mistakes Beginners Make
Trading Based on One Candle
→ Always confirm with the next candle or additional price action.
Ignoring the Trend
→ Even a strong bullish candle may fail in a strong downtrend.
Memorising Patterns Without Understanding
→ Focus on why a pattern forms instead of memorising its name.
Ignoring Volume
→ High volume adds confidence to many candlestick signals.
Overcomplicating the Chart
→ Too many indicators can distract you from understanding price action.
Keep your charts clean and simple.
Practical Tips to Improve Candlestick Reading
• Practise on historical charts every day.
• Mark important support and resistance zones.
• Study one pattern at a time.
• Maintain a trading journal.
• Wait for confirmation before entering trades.
• Combine candlestick analysis with proper risk management.
Example of Reading a Candlestick Chart
Imagine the market has been falling for several days.
A Hammer candle forms near a strong support level.
The next candle closes above the Hammer.
This suggests:
• Sellers lost strength.
• Buyers stepped in.
• A short-term upward move may begin.
Instead of entering immediately after the Hammer, many traders wait for confirmation from the next candle to reduce false signals.
Frequently Asked Questions (FAQs)
Are candlestick charts better than line charts?
→ Yes. Candlestick charts provide much more information because they show the open, high, low, and close prices, whereas line charts typically show only the closing price.
Can beginners learn candlestick charts easily?
→ Yes. By understanding candle structure and practising regularly, beginners can build confidence over time.
Is one candlestick pattern enough to take a trade?
→ No. It is better to combine candlestick patterns with trend analysis, support and resistance, volume, and sound risk management.
Which is the best candlestick pattern?
→ There is no single best pattern. Reliability depends on market context, trend, and confirmation from subsequent price action.
How long does it take to learn candlestick charts?
→ Most beginners can understand the basics within a few weeks of consistent practice. Mastery comes through observing live markets and reviewing past charts.
How to Read Candlestick Charts for Beginners
Final Thoughts
Learning how to read candlestick charts is one of the most valuable skills for any trader. Candlesticks tell the story of the ongoing battle between buyers and sellers, helping you understand market sentiment and make more informed trading decisions.
Remember that no candlestick pattern guarantees profits. The best results come from combining candlestick analysis with trend identification, support and resistance, volume, disciplined risk management, and a well-tested trading plan. Be patient, practise regularly, and focus on understanding price behaviour rather than chasing every pattern.
If this blog makes sense to you give your feedback in comments and stay tuned for more information about JD Trading Zone.
There is a great content got jd trading zone
Pingback: Best Time Frame for Intraday Trading - jdtradingzone.com
Pingback: Price action trading explained learn without indicator - jdtradingzone
Pingback: What is support and resistance? complete beginner guide - jdtradingzone
Needed to log in to ph33comapplogin the other day and it was actually pretty smooth. App worked well, no glitches, easy to get around. If you’re having trouble finding the login, here’s a direct link: ph33comapplogin Might save you some time!