
learn the best indicators for intraday trading in India, how they work, their advantages, limitations, and how beginners can use them effectively.
Welcome to JD Trading Zone
Intraday trading is one of the most popular ways to participate in the Indian stock market. Traders buy and sell shares or derivatives on the same day to capture short-term price movements. However, entering trades without proper analysis often leads to unnecessary losses.
This is where technical indicators become valuable. They help traders identify trends, momentum, support and resistance, and possible entry and exit points. While no indicator guarantees profits, using the right combination can improve decision-making and reduce emotional trading.
Also check:- (How to Read Candlestick Charts for Beginners) (Complete beginners guidance about the stock market) (How to Use Pre-Market Data for Better Intraday Trades) (VWAP with RSI Strategy for More Accurate Trades) (10 Risk Management Rules Every Trader Must Know)
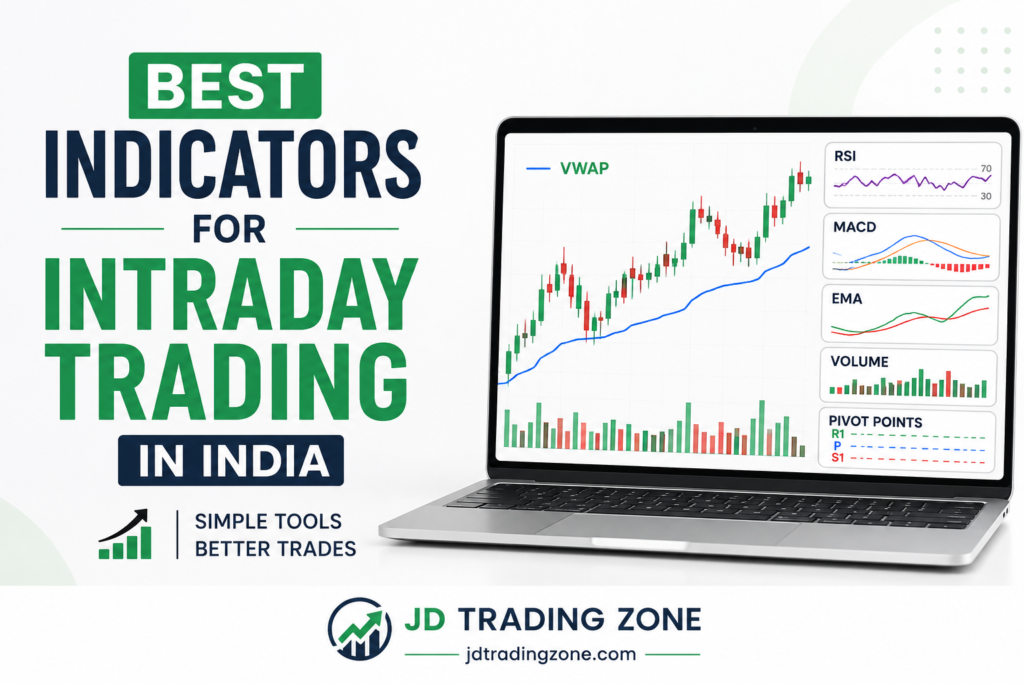
Best Indicators for Intraday Trading
Trading indicators are mathematical calculations based on price, volume, or open interest. They help traders analyse market behaviour and make informed trading decisions.
Indicators are generally divided into four categories:
• Trend indicators
• Momentum indicators
• Volume indicators
• Support and resistance indicators
Each serves a different purpose, which is why experienced traders often combine two or three indicators instead of relying on just one.
Why Should Intraday Traders Use Indicators?
Indicators help traders:
• Identify the market trend
• Find high-probability entry points
• Determine exit levels
• Confirm trade setups
• Reduce emotional decisions
• Improve consistency
Remember that indicators are tools—not prediction machines. Price action and risk management remain equally important.
Here is Best Indicators for Intraday Trading in India
1. VWAP (Volume Weighted Average Price)
→ What is VWAP?
VWAP stands for Volume Weighted Average Price. It calculates the average price of a stock based on both price and trading volume.
Many institutional traders use VWAP because it reflects the average traded price throughout the day.
→ How to Use VWAP
• Price above VWAP indicates bullish strength.
• Price below VWAP indicates bearish strength.
• Buy when price stays above VWAP with strong volume.
• Sell when price remains below VWAP with increasing selling pressure.
→ Advantages
• Excellent for intraday trading
• Helps identify trend direction
• Works well in liquid stocks
• Used by professional traders
→ Limitations
• Less useful in sideways markets
• Should not be used alone
2. RSI (Relative Strength Index)
→ What is RSI?
RSI is a momentum indicator that measures the speed of price movement.
It ranges between 0 and 100.
→ Common RSI Levels
• Above 70 = Overbought
• Below 30 = Oversold
→ How Beginners Can Use RSI
Instead of buying simply because RSI is below 30, wait for:
• Price confirmation
• Trend confirmation
• Volume confirmation
This reduces false signals.
→ Best Use
RSI works particularly well with VWAP and support-resistance analysis.
3. MACD (Moving Average Convergence Divergence)
MACD helps traders identify trend changes and momentum.
→ It consists of:
• MACD Line
• Signal Line
• Histogram
→ Buy Signal
• MACD crosses above Signal Line
• Histogram turns positive
• Price moves above resistance
→ Sell Signal
• MACD crosses below Signal Line
• Histogram turns negative
• Price breaks support
→ Advantages
• Identifies trend reversal
• Easy to understand
• Useful for beginners
4. EMA (Exponential Moving Average)
EMA gives more importance to recent prices than a simple moving average.
→ Popular EMA settings:
• 9 EMA
• 20 EMA
• 50 EMA
• 200 EMA
→ Simple EMA Strategy
Buy when:
• 9 EMA crosses above 20 EMA
• Price is above VWAP
• Volume increases
→ Sell when:
• 9 EMA crosses below 20 EMA
• Price falls below VWAP
This strategy works best during trending markets.
5. Volume Indicator
Volume is one of the most overlooked indicators.
It tells you how many shares or contracts were traded during a particular period.
→ Why Volume Matters
A breakout without volume often fails.
A breakout with high volume is more reliable.
Always confirm breakouts using volume before entering a trade.
6. Pivot Points
Pivot Points help identify important support and resistance levels.
Common levels include:
• Pivot
• Support 1 (S1)
• Support 2 (S2)
• Resistance 1 (R1)
• Resistance 2 (R2)
→ How Traders Use Pivot Points
Buy when:
• Price breaks above Pivot
• Volume increases
• VWAP supports the trend
→ Sell when:
• Price breaks below Pivot
• Momentum weakens
• Volume confirms selling
7. Bollinger Bands
Bollinger Bands measure market volatility.
They consist of:
• Upper Band
• Middle Band
• Lower Band
→ Trading Idea
When the bands expand, volatility increases.
When the bands contract, a significant move may be approaching.
Do not trade solely based on price touching the bands. Always wait for confirmation.
8. Supertrend Indicator
Supertrend is a trend-following indicator popular among Indian traders.
→ Buy Signal
Price closes above the Supertrend line.
→ Sell Signal
Price closes below the Supertrend line.
It performs well during trending markets but can generate false signals in sideways conditions.
Best Indicator Combinations for Intraday Trading
VWAP + RSI
→ Ideal for identifying trend direction with momentum confirmation.
VWAP + MACD
→ Suitable for trend-following traders.
EMA + VWAP
→ Useful for catching pullback entries.
Pivot Points + Volume
→ Helps validate breakout trades.
Supertrend + RSI
→ Provides trend and momentum confirmation together.
Which Indicator Is Best for Beginners?
If you’re just starting, focus on learning only two indicators thoroughly instead of using many at once.
A good beginner combination is:
• VWAP
• RSI
Once you’re comfortable, add:
• MACD
• EMA
• Volume
Keeping your chart simple often leads to better decisions.
Common Mistakes Beginners Make
Avoid these mistakes:
• Using too many indicators
• Ignoring risk management
• Trading without a stop-loss
• Chasing every signal
• Entering trades without volume confirmation
• Overtrading
• Trading against the main trend
Risk Management Is More Important Than Indicators
Even the best indicator cannot guarantee profits.
Successful traders focus on:
• Fixed risk per trade
• Proper stop-loss placement
• Risk-reward ratio of at least 1:2
• Position sizing
• Emotional discipline
Risk management keeps you in the game long enough to improve your skills.
Frequently Asked Questions
Which indicator is best for intraday trading in India?
→ VWAP is considered one of the most reliable indicators for intraday trading because it reflects both price and volume. Many traders combine it with RSI or MACD for better confirmation.
Can I trade using only one indicator?
→ It is possible, but using one additional confirmation tool such as volume or RSI can improve decision-making and reduce false signals.
Which indicator gives the most accurate signals?
→ No indicator is 100% accurate. Accuracy depends on market conditions, risk management, and how well the indicator is used alongside price action.
Which indicators work best for Bank Nifty and Nifty?
→ Many traders use:
• VWAP
• EMA (9 and 20)
• RSI
• MACD
• Volume
• Pivot Points
These indicators can help identify trends and potential trade setups when combined with proper analysis.
Best Indicators for Intraday Trading in India
Final takeaway
Technical indicators are valuable tools, but they are most effective when combined with market structure, price action, and disciplined risk management. Instead of searching for a “perfect” indicator, focus on understanding how each one behaves in different market conditions.
For beginners in India, a practical starting point is to use VWAP, RSI, and Volume together. As your experience grows, you can gradually add EMA, MACD, or Pivot Points to build a trading system that matches your style.
Remember that consistent learning, maintaining a trading journal, and following strict risk management are far more important than using a large number of indicators. A simple, well-tested strategy is usually more effective than a chart crowded with technical tools.
Pingback: What is support and resistance? complete beginner guide - jdtradingzone.com
Took some notes for a project I am working on, and a stop at morix added more raw material to those notes, content that contributes to my own creative work rather than just being interesting in the moment is the kind I value most and the kind I will keep coming back to repeatedly.
Pingback: Price action trading explained learn without indicator - jdtradingzone.com
Pingback: Top 10 mistakes new traders make and how to avoid them - jdtradingzone.com