
In this blog you will learn about macd indicator – How to use it in intraday trading, in simple words and beginners friendly stay tuned for more information.
In intraday trading, timing is everything.
• MACD helps you:
• Find trend changes
• Catch early entries
• Avoid false breakouts
• Confirm trades with other indicators like VWAP and Pivot Points
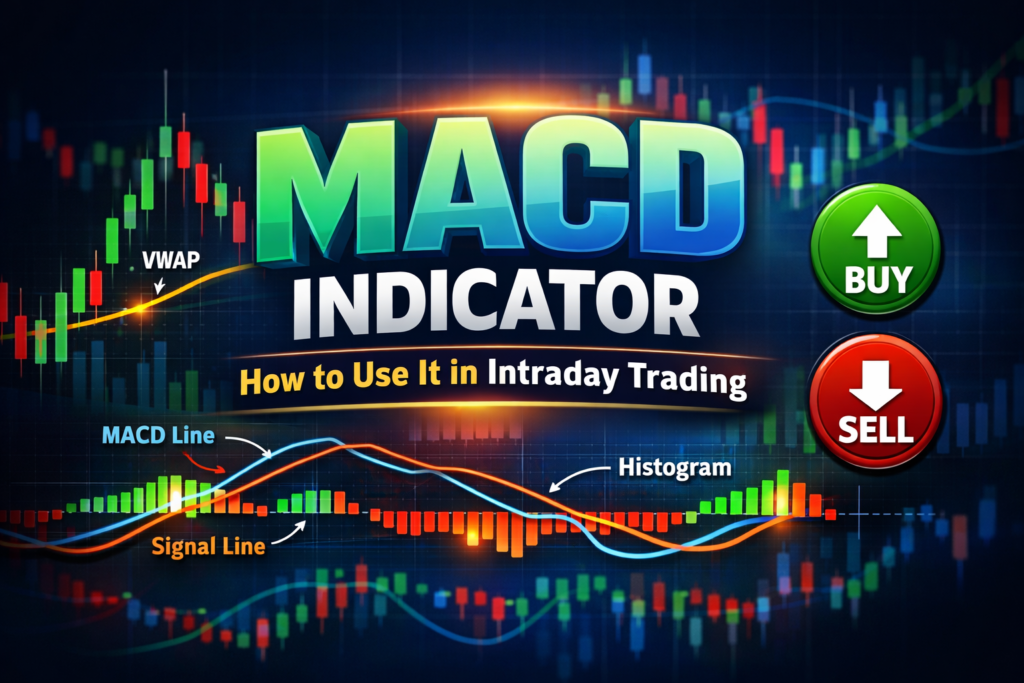
Macd trading strategy
Macd → Moving Average Convergence Divergence
It is a popular momentum indicator used in trading to spot trend direction, strength and possible reversals.
Parts of Macd
1} Macd line → Difference between 12- day Ema and 26- day Ema.
2} Signal line → 9- day Ema of the Macd line
3} Histogram → Bars showing the distance between Macd line and signal line.
How to read Macd
- Zero line cross :
- Macd above 0 → bullish trend.
- Macd below 0 → barish trend .
Example in intraday :
- If stock is above pivot point and Macd crossover up → strong buy signal.
- If stock is below pivot and Macd crossover down → strong sell signal.
In short:
Macd = trend+ momentum+ reversal signals in one tool.
How to use Macd for buy signal
- Watch for crossover
- When the Macd line crosses above the signal line it’s a bullish crossover → buy signal.
- Best if this happens below the zero line and moves upward.
2. Check Histogram
- Histogram changes from negative to positive.
This confirms momentum shifting to the upside.
3. Confirm trend
- If the Macd is rising above zero line, the trend is already bullish.
- A crossover above zero, strong continuation Buy signal.
4. Entry and exit
- Entry: at or just after a bullish crossover.
- Exit: when Macd line crosses back below signal line or price reaches pivot resistance.
Example:
Suppose a stock is at pivot= 100
- Macd line crosses above signal line at price 102.
- Histogram turns positive.
- Buy at 102.
- Target: to day’s resistance.
- Stop loss: 100 or according to your risk reward ratio.
How to use Macd for selling
- Bearish crossover
- When the Macd line crossover below the signal line → sell signal.
2. Check Histogram
- Histogram changes from positive to negative.
- Confirms momentum shifting to downside.
3. Confirm trend direction
- If Macd is below the zero line, trend is bearish
- A crossover below zero= strong continuation sell signal.
4. Entry and exit
- Entry: just after a bearish crossover.
- Exit : when Macd line crosses back above signal line or price reaches support line.
Example:
- Macd line crosses below signal line at 198.
- Histogram turns negative.
- Sell at 198.
- Target= support
- Stop loss = 200 or according to your risk reward ratio.
How to use macd in the real market
How to use Macd in the real market
- Set up your chart
- Use a 5- min or 15- min time frame chart for intraday.
- Default macd settings are good for most stocks and indices.
2. Identify the market bias
- If Macd is above zero line → market trend is bullish.
- If Macd is below zero line → market trend is bearish.
- This helps you avoid trading against the bigger trend.
3. Wait for crossover
- Bullish signal: Macd line crosses above signal line.
- Bearish signal: Macd line crosses below signal line.
Don’t enter instantly – wait for the candle to close to avoid fake signals.
4. Plan your trade
- Entry: after confirmed crossover.
- Target: day high.
- Stop loss: just beyond the last swing high/ low.
5. Avoid false signals
- In sideways/ choppy market, Macd gives many whipsaws.
- Best results: trade when there is clear momentum+ volume.
Example in intraday
Suppose nifty at 20,000
- The price is at 20,050.
- Macd line crosses above signal line on 15- min chart.
- Histogram turns positive.
- Entry at 20,050
- Target at 20, 100
- Stop loss at 20, 000
Using Pivot point with Macd for better confirmation
- Check market trends with pivots.
- Above pivot → look for buy setup
- Below pivot → look for sell setup
2. Confirm with Macd
- Buy signal: Macd line crosses above signal line+ histogram turns positive.
- Sell signal: Macd line crosses below signal line+ histogram turns negative.
3. Combine both
Best buy setup:
- Price above pivot
- Macd crossover upward near pivot or S1
- Target= R1/R2
- Stop loss = below pivot/s1
Best sell setup:
- Price below pivot
- Macd crossover downward near pivot or R1.
- Target= s1/s2
- Stop loss = above pivot/ R1.
Example
Pivot= 100
- Price= 102 above pivot.
- Macd crossover up happens at 102, histogram turns green. Buy entry
- Target= R1
- Stop loss = 99
OrP
Pivot= 200
- Price= 198 below pivot.
- Macd crossover down happens at 198 – sell signal.
- Target= s1
- Stop loss = 202
Using RSI indicator with Macd for better confirmation
- Macd = shows trend direction and momentum.
- RSI = shows overbought/ oversold zones and strength.
When you combine them you filter out false signals.
- Buy setup
- Macd : bullish crossover
- RSI: between 40-60 and moving upward
- If Rsi is oversold and macd gives bullish crossover= very strong buy
- Target= recent resistance
- Stop loss = recent swing low
2. Sell setup
- Macd: bearish crossover
- RSI: between 40-60 and moving downward
- If Rsi is overbought and Macd gives a bearish crossover = very strong sell.
- Target – support
- Stop loss – recent swing high.
3. RSI divergence+ Macd Confirmation
- If Rsi shows divergence and Macd gives bearish crossover – strong sell signal
- Same for bullish divergence + macd crossover upward – strong buy
Example
Stock at 200
- RSI – 45 and rising
- Macd crossover up happens at 202 buy signal
- Target R1 205
- Stop loss – 198
Or
- RSI= 70+ overbought
- Macd crossover down at 199 sell entry
- Target s1
- Stop loss 202
Is Macd really good for intraday trading
- Trend + momentum in one tool
- Shows whether the market is bullish or bearish.
- Also tells you the strength of the move with the histogram.
2. Clear buy / sell signal
- Bullish crossover line below= buy signal.
- Bearish crossover line below= Sell signal
3. Filters false moves – works better than RSI alone because it confirms momentum, not just overbought/ oversold.
4. Works on any timeframe – on 5-min or 15- min charts macd helps short-term momentum shifts.
Limitations in intraday
- Lagging indicator: since Macd is based on moving overages , it reacts late to sudden moves.
- Sideways market: gives too many false signals when the price is flat.
- Best used with pivot point, Vwap or RSI for confirmation.
Macd is really good for intraday if :
- You use it on liquid stocks/ index
- You combine it with pivot point or Vwap for levels
- You avoid trading only on Macd crossovers in sideways markets.
Important things to notice: ( macd indicator – how to use it in intraday trading)
- Don’t trade every crossover → use Macd only at key levels.
- Focus on quality signals , not quantity.
- Always check the bigger time frame to avoid trading against the main trend.
- Use 15- min time frame chart for cleaner Macd signals.
- If Macd crossovers happen exactly at pivot levels, that’s a very strong signal.
- Avoid trades when Macd is flat and price is stuck around pivots.
❓ Frequently Asked Questions (FAQ)
1. Is MACD good for intraday trading?
→ Yes, MACD works very well for trend-based intraday trading when combined with VWAP or Pivot Points.
2. Which MACD setting is best for intraday?
→ Default setting 12,26,9 is best for most traders.
3. Can beginners use MACD?
→ Yes, MACD is beginner-friendly and easy to understand.
✅ Final Verdict
The MACD indicator is a powerful, reliable, and simple tool for intraday traders. But remember:
⚠️ Never use MACD alone. Always combine it with VWAP, Pivot Points, or Support & Resistance.
If this strategy makes sense to you try applying it in your next trade and share your results in the comments.
In the next blog i will share the best trading apps in India for a better experience.
At the end of the day
Trading isn’t about timing in the market it’s about time in the market.
- What is price action analysis?
- Importance of consistency and discipline in trading
- How to start intraday trading In India with small capital
- What is technical analysis in the stock market
- What is Support and Resistance & Supply and Demand in stock market
- Chart patterns complete beginners guidance
- Complete beginners guidance of candlestick patterns
- Types of trading in the stock market
- Complete beginners guidance about the stock market
- How to use pre market data for better intraday trades
- How to use Vwap with RSI for more accurate trades
- 10 risk management rules every trader must follow
- How to control emotions while trading.
- Best laptop for stock market trading in 2025
- Best time to trade nifty and banknifty for maximum profit
- Best charting platform for intraday traders
- Top ten trading books every trader must read
- Zerodha vs upstox vs angelone best brokers in India.
- Top 5 scalping strategies for beginners
- Macd+ Vwap combo strategy for better accuracy.
Pingback: Top 5 scalping strategies for beginners - jdtradingzone.com
Pingback: Macd+ Vwap combo strategy for better accuracy. - jdtradingzone.com