
Are you interested in stock market so let’s explore about what is technical analysis in the stock market, in simple words and beginners friendly.
When I first came across technical analysis, I thought it was mainly about adding indicators to a chart and waiting for one of them to give a Buy or Sell signal.
That turned out to be the wrong way to look at it.The more charts I studied, the more I realized that technical analysis starts with price.
Indicators can help organize information, but the chart itself is where the story begins.
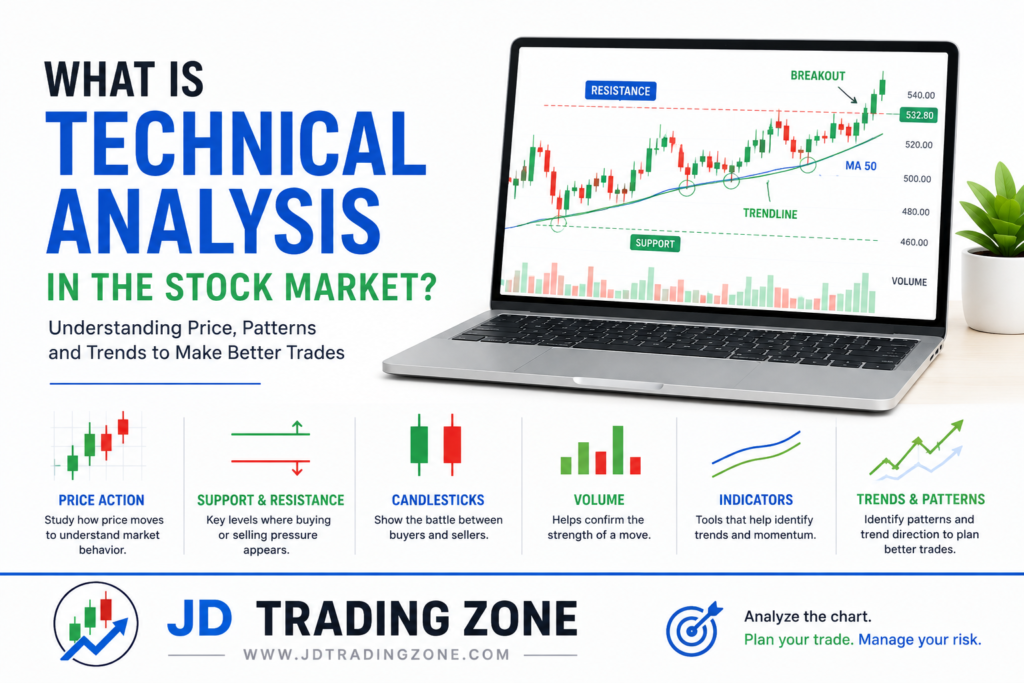
Technical analysis is essentially a way of studying price movement, volume, market structure, and recurring patterns to make more informed trading decisions.
It doesn’t tell me what a stock must do next.Instead, it helps me build a plan around different possibilities.
🔍 What is Technical Analysis?
Technical analysis is a method of analyzing stocks, indices, or any financial instrument by studying:
• Price movements
• Chart patterns
• Trading volume
• Indicators and historical data
The main goal of technical analysis is:
✅ To predict future price movements based on past price behavior.
Unlike fundamental analysis, technical analysis does not focus on company profits, news, or balance sheets. It focuses only on price action and charts.
🧠 Basic Principle of Technical Analysis
Technical analysis works on three main assumptions:
1️⃣ Price Discounts Everything
→ All news, results, emotions, and events are already reflected in the price.
2️⃣ Price Moves in Trends
Prices don’t move randomly. They move in trends:
• Uptrend
• Downtrend
• Sideways trend
3️⃣ History Repeats Itself
→ Chart patterns and price behavior repeat because human psychology repeats.
📊 What Do Traders Study in Technical Analysis?
In technical analysis, traders mainly analyze:
• ✅ Price charts
• ✅ Candlestick patterns
• ✅ Chart patterns
• ✅ Support and Resistance
• ✅ Indicators (RSI, MACD, VWAP, Moving Averages, etc.)
• ✅ Volume
(You already use VWAP, MACD & Pivot Points — all are part of technical analysis.)
🛠️ Main Tools of Technical Analysis
📉 1. Charts
• Line Chart
• Bar Chart
• Candlestick Chart (most popular)
🕯️ 2. Candlestick Patterns
Examples:
• Doji
• Hammer
• Engulfing
• Morning Star
• Shooting Star
They help in predicting reversals and continuations.
📐 3. Chart Patterns
Examples:
• Head and Shoulders
• Double Top / Bottom
• Triangle
• Flag & Pole
They show market structure and trend direction.
📏 4. Support and Resistance
• Support = price level where buying comes
• Resistance = price level where selling comes
Very important for:
• Entry
• Exit
• Stop loss
• Target
📊 5. Technical Indicators
Popular indicators:
• RSI
• MACD
• VWAP
• Moving Averages
• Bollinger Bands
• Pivot Points
They help in:
• Finding trend
• Overbought / oversold zones
• Momentum
• Confirmation of signals
⏱️ Who Uses Technical Analysis?
Technical analysis is used by:
• Intraday traders
• Swing traders
• Options traders
• Crypto traders
• Forex traders
It is especially useful for short-term trading.
( what is technical analysis in the stock market)
✅ Advantages of Technical Analysis
✔ Works in any market (stocks, forex, crypto)
✔ Helps in perfect entry & exit timing
✔ Can be used for intraday, swing & positional
✔ Clear risk management using stop loss
✔ Saves time compared to fundamental analysis
Disadvantages of Technical Analysis
❌ Sometimes gives false signals
❌ Needs practice and experience
❌ Indicators can lag
❌ Emotional trading can spoil results
🚀 How Beginners Should Start Technical Analysis
If you are a beginner, follow this order:
1️⃣ Learn candlestick patterns
2️⃣ Learn support & resistance
3️⃣ Learn basic chart patterns
4️⃣ Learn 2–3 indicators (RSI, VWAP, MACD)
5️⃣ Practice on paper trading
6️⃣ Follow strict risk management
The Way I Would Explain Technical Analysis to a Beginner
Don’t think of technical analysis as:
“Finding an indicator that tells me when to buy.”
Think of it as:
“Reading the information already visible in price and using it to build a plan.”
Start with price action and market structure.Then learn support and resistance, volume, candlestick behavior, and a few indicators.
You don’t need a chart filled with tools to become better at technical analysis.
You need to become better at understanding why price is behaving the way it is—and knowing what would prove your idea wrong.
That is where technical analysis becomes genuinely useful.
📌 Remember: Indicators don’t make money. Discipline, risk management, and psychology
Pingback: What is Swing trading? - jdtradingzone.com