
Hello guys today we will discuss about complete beginners guidance of candlestick patterns , fully beginners guidance and in simple words.
When I first started looking at candlestick charts, I made the same mistake many beginners make:
I tried to memorize every candlestick pattern I could find.Doji. Hammer. Shooting Star. Engulfing. Morning Star. Evening Star.
I knew the names, but that didn’t automatically make me better at reading the market.The bigger lesson came later: a candlestick doesn’t tell the whole story by itself.
What matters is where the candle appears, what price was doing before it, how strong the move was, and whether the next candles confirm the idea.
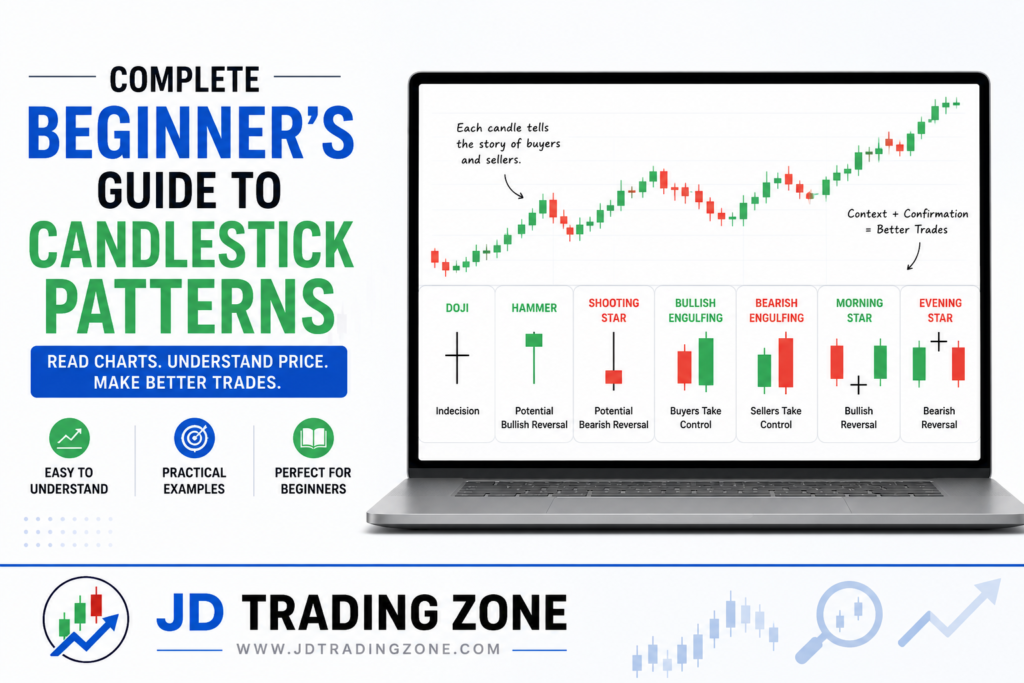
The First Thing I Look At Is the Candle’s Location
Suppose I see a Hammer.
A beginner may immediately think:“Hammer = buy.”
I wouldn’t look at it that way.A Hammer appearing after a prolonged decline near an important support level can be interesting.
The same-looking candle appearing randomly in the middle of a sideways market doesn’t carry the same meaning.
The location changes the meaning of the candle.
🕯️ What Is a Candlestick?
A candlestick shows the price movement of a stock during a specific time period (5 min, 15 min, 1 hour, 1 day, etc).
Each candlestick has 4 parts:
• Open – Price where market opened
• Close – Price where market closed
• High – Highest price
• Low – Lowest price
Structure of a Candlestick:
• Body – Difference between open and close
• Wick (Shadow) – Shows high and low prices
Colors:
• 🟢 Green (Bullish) → Price closed higher than opened
• 🔴 Red (Bearish) → Price closed lower than opened
—
📈 Why Candlestick Patterns Are Important?
Candlestick patterns help you:
• Identify trend reversal
• Spot trend continuation
• Find entry and exit points
• Understand buyer and seller strength
They work very well in:
• Intraday trading
• Swing trading
• Options trading
• Forex and crypto
—
🔰 Types of Candlestick Patterns
There are 3 main types:
1. Bullish Reversal Patterns (Market may go up)
2. Bearish Reversal Patterns (Market may go down)
3. Continuation Patterns (Trend may continue)
—
✅ Important Bullish Candlestick Patterns
1. Hammer 🔨
• Small body, long lower wick
• Forms after a downtrend
• Indicates trend reversal upward
2. Inverted Hammer
• Small body, long upper wick
• Appears near bottom
• Signals buying pressure
3. Bullish Engulfing
• Big green candle covers previous red candle
• Very strong buy signal
4. Morning Star ⭐
• 3 candle pattern
• Indicates strong reversal from downtrend
—
❌ Important Bearish Candlestick Patterns
1. Shooting Star 🌠
→ Small body, long upper wick
• Appears after uptrend
• Indicates price may fall
2. Hanging Man
→ Looks like a hammer but forms at the top.
•Signals trend reversal downward
3. Bearish Engulfing
→ Big red candle covers previous green candle
• Strong sell signal
4. Evening Star 🌙
→ 3 candle pattern
• Signals trend reversal from uptrend
—
🔁 Continuation Candlestick Patterns
1. Doji
• Open and close almost same
• Shows indecision
• Breakout decides direction
2. Spinning Top
• Small body, long wicks
• Market is confused
• Often appears before big move
—
🧠 How to Trade Using Candlestick Patterns (Smart Way)
❗ Never trade using candlestick patterns alone.
Always combine with:
✅ VWAP (you already use this)
✅ MACD
✅ Pivot Points
✅ Support & Resistance
✅ Volume
Example Strategy:
If Bullish Engulfing forms near Support or VWAP → Look for BUY
If Bearish Engulfing forms near Resistance or Pivot → Look for SELL
—
⚠️ Common Mistakes Beginners Make
→ Trading every pattern ❌
→ Ignoring trend ❌
→ Not using stop-loss ❌
→ Not waiting for candle close ❌
—
🛡️ Risk Management Rules
• Always use stop-loss
• Risk only 1–2% capital per trade
• Don’t overtrade
• Trade only best setups
The Rule I Would Remember
Don’t memorize candlestick patterns just to recognize shapes.
Learn to understand the battle between buyers and sellers that the candle represents.
A candle is evidence—not a prediction.
When you combine candlestick structure + market trend + support/resistance + volume + confirmation, the chart starts telling a much clearer story.
And that is a far more useful skill than simply knowing the names of 50 candlestick patterns.
Купить пластиковые окна на заказ в Москве — это отличный способ улучшить энергоэффективность вашего дома и повысить его комфорт.
Основное преимущество пластиковых окон заключается в их долговечности.
Купить пластиковые окна на заказ в Москве — это отличный способ улучшить энергоэффективность вашего дома и повысить его комфорт.
Вам предложат разнообразные варианты по стоимости и срокам выполнения заказа.
Pingback: What is technical analysis in the stock market - jdtradingzone.com
Pingback: What is price action analysis? - jdtradingzone.com
Pingback: What is Fibonacci retracement? - jdtradingzone.com