
If you want to learn about how the Opening Range Breakout strategy, how to identify entries and stop-losses, which timeframe beginners can use, common mistakes to avoid, and how to build a simple ORB trading plan.
Welcome to JD Trading Zone
Disclaimer: This article is for educational purposes only and is not financial advice. Trading stocks, futures, or options involves risk, and losses can exceed expectations. Always understand the risks and test a strategy before using real money.
Opening Range Breakout (ORB) is a popular intraday trading strategy that focuses on the price range created during the first few minutes of a trading session. Traders wait for the market to establish an initial high and low, then look for a breakout above or below that range.
The idea is simple: when price moves decisively outside the opening range with supporting volume and market momentum, it may signal the beginning of a stronger intraday move.
However, an opening-range breakout is not automatically a buy or sell signal. False breakouts are common, especially when the market is choppy. A good ORB strategy therefore combines the opening range with price action, volume, broader market direction, and disciplined risk management.
Also check:- (EMA Crossover Strategy Explained) (VWAP Trading Strategy Step by Step) (Volume Price Analysis (VPA) for Beginners) (Fake Breakouts vs Real Breakouts) (How to Trade Breakouts Successfully)
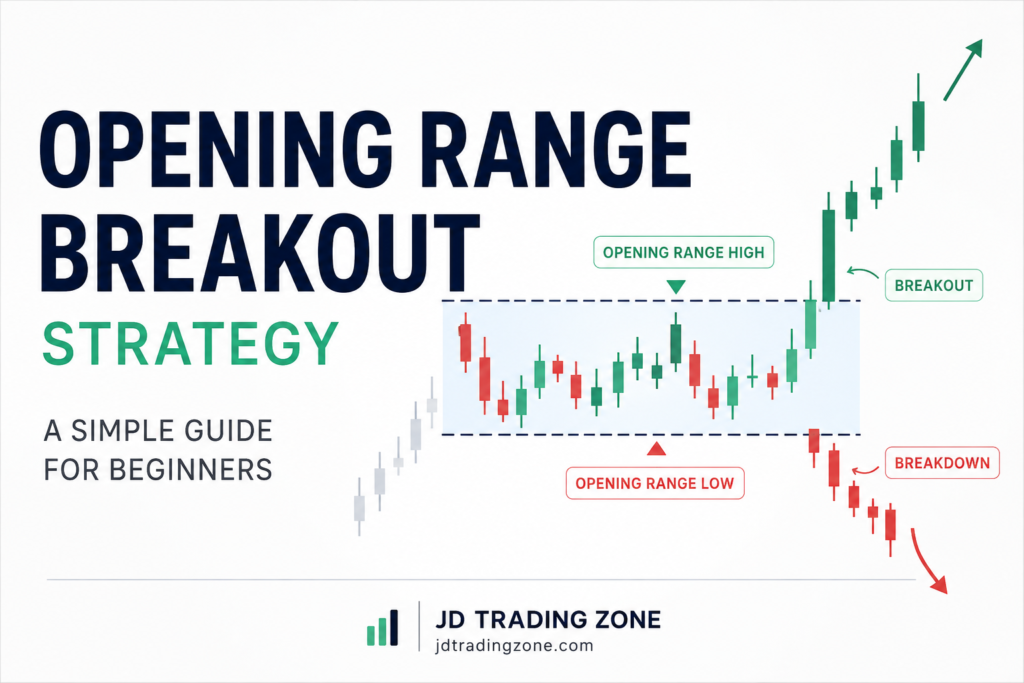
Opening Range Breakout Strategy
What Is the Opening Range Breakout Strategy?
The Opening Range Breakout strategy, commonly called ORB, uses the high and low formed during a predefined period immediately after the market opens.
For example, a trader might define the opening range as the first 15 minutes of the trading session.
Suppose a stock trades between:
• Opening range high: ₹520
• Opening range low: ₹510
The range is therefore ₹10.
A trader then waits for price to move outside this range.
→ Bullish ORB
If price breaks and sustains above ₹520, a trader may look for a potential long setup.
→ Bearish ORB
If price breaks and sustains below ₹510, a trader may look for a potential short setup.
The important word is “potential.”
A simple move above the opening high does not guarantee that price will continue higher. Price can break the level and quickly return inside the range. This is known as a false breakout or failed breakout.
Why Does the Opening Range Matter?
The market open can be one of the most active periods of the trading day.
Several factors may influence price at the opening:
• Overnight market movements
• Global market sentiment
• Company-specific news
• Economic announcements
• Previous-day support and resistance
• Institutional orders
• Gap-up or gap-down openings
• Strong buying or selling interest
Because of this activity, the first few minutes can establish an important short-term battle between buyers and sellers.
The opening range provides traders with a simple reference point.
Instead of predicting where price will go, the trader waits for the market to reveal its initial direction.
How Does an ORB Strategy Work?
The basic ORB process has five stages:
1. Choose an opening-range period.
2. Mark the opening high and low.
3. Wait for price to approach either boundary.
4. Look for confirmation of a breakout.
5. Enter with a predefined stop-loss and target.
The strategy can be used with different markets and timeframes, but the exact rules should be tested rather than assumed to work universally.
Step-by-Step Opening Range Breakout Strategy
Step 1: Select the Opening Range
First, decide how long your opening range will be.
Common choices include:
• 5 minutes
• 15 minutes
• 30 minutes
• 60 minutes
For beginners, a 15-minute opening range can be easier to understand because it provides enough price information without making the setup unnecessarily complicated.
The best period depends on the market, trading style, liquidity, and timeframe.
There is no universally “best” ORB period.
Step 2: Mark the Opening High and Low
Once your selected period ends, identify:
• Highest price during the range
• Lowest price during the range
These two levels become your ORB boundaries.
For example:
→ 15-minute opening range
High = ₹1,250
Low = ₹1,230
Your important levels are:
• ₹1,250 → breakout level
• ₹1,230 → breakdown level
You now wait for price to move outside this area.
Step 3: Wait for a Breakout
A bullish setup occurs when price moves above the opening range high.
A bearish setup occurs when price moves below the opening range low.
But beginners should avoid treating every wick outside the range as a genuine breakout.
Consider looking for additional evidence such as:
• Strong candle close outside the range
• Increased volume
• Momentum in the breakout direction
• Broader market confirmation
• Retest and hold of the breakout level
• Clear price structure
The goal is not to predict the breakout.
The goal is to react to confirmed market information.
Step 4: Confirm the Breakout With Volume
Volume can provide useful context when evaluating an ORB breakout.
Imagine a stock has an opening high of ₹500.
Price moves to ₹503, but volume is weak and the candle closes back below ₹500.
That breakout may have less convincing evidence.
Now imagine price breaks ₹500 with a strong bullish candle while volume increases significantly compared with recent candles.
That can provide stronger confirmation.
However, volume should not be treated as a guarantee.
High volume can occur during both successful and failed breakouts.
A simple rule
Instead of asking:
“Did price break the level?”
Ask:
“Did price break the level with convincing participation and follow-through?”
That is a much better question.
Step 5: Entry Rules
There are several ways to enter an ORB trade.
→ Method 1: Direct Breakout Entry
A trader enters after price breaks the opening range.
Example
Opening high = ₹500
Price closes above ₹500 and moves to ₹503.
A trader may consider a long entry after confirmation.
The advantage is that you enter early if a strong trend develops.
The disadvantage is that you can get caught in a false breakout.
→ Method 2: Breakout and Retest
This approach waits for price to break the opening range and then return to test the breakout level.
For example:
Opening high = ₹500
Price breaks to ₹508.
Then price pulls back toward ₹500–₹502.
If buyers defend the former resistance area and price begins moving higher again, the retest can provide a more structured entry.
The potential advantage is better confirmation.
The disadvantage is that price may never retest the level, causing you to miss the trade.
Step 6: Where Should the Stop-Loss Go?
Stop-loss placement should be determined before entering the trade.
For a bullish ORB trade, a stop-loss might be placed:
• Below the breakout level
• Below the retest low
• Below a nearby logical support area
• Below the opening range, depending on the strategy
For a bearish ORB trade, the stop-loss might be placed:
• Above the breakdown level
• Above the retest high
• Above nearby resistance
There is no single stop-loss distance that works for every stock.
The stop should be based on market structure and the amount of risk you are willing to accept.
Risk Management Is More Important Than the Entry
A good entry cannot compensate for poor risk management.
Suppose your trading account is ₹1,00,000 and you decide to risk 1% on one trade.
Maximum planned loss:
₹1,00,000 × 1% = ₹1,000
If your stop-loss distance is ₹5 per share:
Position size = ₹1,000 ÷ ₹5 = 200 shares
This is a simplified example and does not include brokerage, taxes, slippage, or other trading costs.
The important principle is:
Decide your maximum acceptable loss first, then calculate the position size.
Do not decide position size first and then try to fit the stop-loss around it.
Step 7: Set a Profit Target
There are several ways to manage ORB profits.
Fixed Risk-to-Reward Ratio
One simple approach is using a predefined risk-to-reward ratio.
For example:
If your stop-loss risk is ₹5 per share and you target a 1:2 risk-to-reward ratio:
Target = ₹10 per share
So:
Entry = ₹505
Stop-loss = ₹500
Risk = ₹5
Target = ₹515
A fixed ratio is simple, but it does not guarantee profitability.
Your overall results depend on your win rate, trading costs, execution, and consistency.
Previous Support and Resistance
Another approach is to use nearby technical levels.
For a bullish breakout, possible target areas may include:
• Previous swing high
• Daily resistance
• Previous day’s high
• Major psychological level
• Higher-timeframe resistance
This approach allows the market structure to influence the target instead of using an arbitrary number.
Trailing Stop-Loss
Some traders prefer to let profitable ORB trades run.
For example:
• Enter after confirmation.
• Move the stop as price creates higher lows.
• Exit when the trend structure breaks.
This can potentially capture larger moves, but it also means some open profits may disappear before the trade exits.
A Complete ORB Example
Let’s consider a hypothetical stock.
The market opens at ₹1,000.
During the first 15 minutes:
Opening high = ₹1,015
Opening low = ₹995
The trader marks both levels.
Later, price moves above ₹1,015.
A bullish candle closes at ₹1,019, and volume increases.
Instead of buying immediately just because the level was crossed, the trader waits for additional confirmation.
Price pulls back to ₹1,015–₹1,017 and finds buying support.
The trader enters around ₹1,018.
Suppose the logical stop is ₹1,012.
Risk:
₹1,018 − ₹1,012 = ₹6 per share
If the trader uses a 1:2 risk-to-reward target:
Potential target:
₹1,018 + ₹12 = ₹1,030
The trade plan is therefore:
Entry: ₹1,018
Stop-loss: ₹1,012
Risk: ₹6
Target: ₹1,030
Potential reward: ₹12
This is only a hypothetical example. Real markets can move differently, and actual execution may vary because of volatility and slippage.
ORB With VWAP
Traders sometimes combine ORB with VWAP (Volume Weighted Average Price) to add market context.
For example, a bullish ORB breakout may have stronger context when:
• Price breaks above the opening range high.
• Price is above VWAP.
• VWAP is relatively stable or rising.
• Volume supports the breakout.
• Broader market conditions are also supportive.
Similarly, a bearish ORB setup may have additional confirmation when:
• Price breaks below the opening range low.
• Price remains below VWAP.
• Selling volume increases.
• Market structure is bearish.
VWAP should not be treated as a guarantee. It is simply another piece of information.
How to Identify a Strong ORB Breakout
A potentially stronger breakout often has several characteristics.
1. Strong candle close
→ Price closes clearly beyond the opening range rather than merely producing a wick.
2. Increased volume
→ Trading activity expands during the breakout.
3. Momentum
→ Price continues moving in the breakout direction instead of immediately returning into the range.
4. Market confirmation
→ If trading an individual stock, the broader index or sector can provide useful context.
5. Clean price structure
→ The breakout is not immediately running into a major resistance or support level.
6. Successful retest
→ Price breaks the level and then holds it during a pullback.
No single factor confirms a successful breakout. The combination provides better context.
What Is a False ORB Breakout?
A false breakout happens when price moves outside the opening range but fails to continue.
For example:
Opening high = ₹800
Price moves to ₹805.
Traders assume a bullish breakout.
Then price quickly falls back below ₹800.
The breakout has failed.
False breakouts are one of the biggest challenges of ORB trading.
They can happen because of:
• Low liquidity
• Profit booking
• Market uncertainty
• News volatility
• Strong opposing levels
• Stop-loss hunting
• Lack of follow-through
This is why a stop-loss is essential.
How to Avoid Some False Breakouts
You cannot eliminate false breakouts completely.
Instead, you can create rules that may reduce unnecessary entries.
→ Wait for a candle close
Instead of reacting to an intraday wick, wait for a meaningful close beyond the level.
→ Check volume
Look for evidence that participation increased during the breakout.
→ Watch the retest
A successful retest can provide additional confirmation.
→ Check higher-timeframe levels
A breakout directly into major resistance may have limited room to move.
→ Consider the broader market
A bullish stock breakout against a strongly bearish market may require additional caution.
→ Avoid chasing extended candles
If price has already moved significantly away from the breakout level, entering late can increase risk.
Best Timeframe for ORB Trading
There is no universal best timeframe.
The right timeframe depends on the market and trading style.
→ 5-Minute ORB
Advantages:
• More trading opportunities
• Faster signals
Disadvantages:
• More noise
• More false breakouts
• Requires quick decision-making
→ 15-Minute ORB
Advantages:
• Simple for beginners
• Less market noise than very short ranges
• Clearer opening structure
Disadvantages:
• Fewer opportunities
• Some moves may happen before confirmation
→ 30-Minute ORB
Advantages:
• Larger opening structure
• Potentially fewer false signals
Disadvantages:
• Later entries
• Wider ranges can create larger stop-loss requirements
The best approach is to backtest different opening periods rather than assuming one timeframe is automatically superior.
ORB Strategy for Indian Stock Markets
The ORB concept can be applied to Indian equities and index markets, but traders should account for the characteristics of the market being traded.
For example, an ORB setup can be evaluated using:
• Nifty 50
• Bank Nifty
• Individual liquid stocks
• Other highly traded instruments
When trading options, remember that the option price is affected by more than the underlying’s direction.
Option traders also need to consider:
• Implied volatility
• Time decay
• Bid-ask spread
• Liquidity
• Expiry
• Option Greeks
• Slippage
Therefore, an ORB signal on the underlying does not automatically mean that buying an option will produce the same quality of trade.
Common ORB Trading Mistakes
1. Entering Every Breakout
Not every breakout is worth trading.
A strategy needs filters.
2. Ignoring Volume
Price movement without supporting participation can sometimes produce unreliable breakouts.
3. Entering Too Late
Chasing a breakout after a large move can create an unfavorable risk-to-reward setup.
4. Using a Very Tight Stop
A stop placed too close to the entry can be triggered by normal market fluctuations.
5. Using an Extremely Wide Stop
A huge stop can create excessive account risk.
The solution is to adjust the position size rather than simply increasing the risk.
6. Revenge Trading
If the first ORB trade loses, some traders immediately take another trade to recover the loss.
This can turn a normal losing trade into a much larger problem.
7. Overtrading
You do not need to trade every market movement.
Sometimes the best ORB trade is no trade.
8. Ignoring Major News
Unexpected news can cause rapid movements and invalidate normal technical setups.
Traders should know whether major scheduled events could affect the market before taking an intraday position.
A Simple ORB Trading Checklist
Before entering an ORB trade, ask:
Market Context
☐ Is the market trending or ranging?
☐ Is there any major scheduled news?
☐ Is the broader market supportive?
ORB Setup
☐ Have I clearly marked the opening high?
☐ Have I clearly marked the opening low?
☐ Has price actually broken the range?
Confirmation
☐ Did the candle close beyond the level?
☐ Is volume supportive?
☐ Is there follow-through?
☐ Is the breakout running directly into major support or resistance?
Risk
☐ Where is my stop-loss?
☐ How much money am I risking?
☐ Is the position size appropriate?
☐ Is the potential reward reasonable?
Discipline
☐ Am I chasing the trade?
☐ Am I trading because of my setup or because of FOMO?
☐ Have I already reached my daily loss limit?
If several answers are unfavorable, skipping the trade may be the better decision.
Advantages of the Opening Range Breakout Strategy
Simple to Understand
→ The strategy is based on clearly defined price levels.
Works With Price Action
→ You do not necessarily need a chart filled with indicators.
Provides Defined Levels
→ The opening high and low give traders objective reference points.
Can Be Used Across Markets
→ The concept can be adapted to various liquid instruments.
Suitable for Rule-Based Trading
→ Traders can create clear entry, stop-loss, and exit rules.
Limitations of ORB Trading
ORB is not a perfect strategy.
False Breakouts
→ Price can frequently move beyond the range and reverse.
Market Noise
→ Shorter opening ranges can produce many unreliable signals.
Volatility Changes
→ A strategy that works in trending markets may behave differently in sideways markets.
Late Entries
→ Waiting for confirmation can sometimes mean entering after part of the move has already occurred.
No Guaranteed Results
→ Past performance does not guarantee future results.
These limitations should be considered before using ORB with real money.
ORB Trading: The Most Important Lesson
The biggest mistake beginners make is thinking that the Opening Range Breakout strategy is simply:
“Mark the high and low → breakout → buy or sell.”
Real trading is more complicated.
A better process is:
Opening Range → Market Context → Breakout → Confirmation → Risk Management → Execution → Exit → Review
The goal is not to predict every move.
The goal is to create a repeatable process where your potential loss is controlled and your decisions are based on predefined rules.
Frequently Asked Questions About ORB
Is the Opening Range Breakout strategy good for beginners?
→ It can be useful for learning structured intraday trading because the setup has clearly defined levels. However, beginners should practice and backtest it before risking real money.
What is the best ORB timeframe?
→ There is no universally best timeframe. Fifteen minutes is a practical starting point for many beginners, but 5-, 30-, and 60-minute ranges can also be tested.
Does ORB work every day?
→ No. Some days produce strong trends, while others remain sideways and generate multiple false breakouts.
Can ORB be used for Nifty and Bank Nifty?
→ The concept can be applied to index markets, but traders should test the specific rules on the instrument they intend to trade.
Can ORB be used for options trading?
→ Yes, traders can use the underlying’s ORB movement as part of an options strategy. However, option-specific factors such as implied volatility, liquidity, time decay, and spreads must also be considered.
Should I use VWAP with ORB?
→ VWAP can be used as an additional market-context or trend filter, but it is not necessary. Adding an indicator should improve your decision process rather than make the strategy unnecessarily complicated.
How much money should I risk per ORB trade?
→ There is no universal percentage suitable for everyone. The amount should be small enough that a losing streak does not seriously damage your account. Your position size should be calculated from your predefined risk and stop-loss distance.
Is ORB profitable?
→ ORB can be profitable under some market conditions and with some rule sets, but profitability is not guaranteed. The exact results depend on the market, timeframe, entry rules, exits, costs, and risk management. Backtesting and forward testing are essential.
Final verdict
The Opening Range Breakout strategy is a straightforward way to structure an intraday trading plan around the market’s initial price range.
Its strength is its simplicity: traders know which levels matter and can define their entry, stop-loss, and target before entering a trade.
But simplicity should not be confused with certainty.
A successful ORB approach requires more than simply buying above the opening high or selling below the opening low.
Market context, volume, breakout quality, risk management, position sizing, and discipline all matter.
For beginners, the best approach is to start with a simple set of rules, backtest the strategy, maintain a trading journal, and gradually improve the system based on evidence rather than emotion.
Remember: the objective of trading is not to catch every breakout. It is to manage risk and take only the setups that fit your trading plan.
Pingback: Gap-Up and Gap-Down Trading Guide - jdtradingzone.com
Pingback: How to Avoid Overtrading - jdtradingzone.com