
In this beginner-friendly guide, you’ll learn everything you need to know about Volume Price Analysis (VPA) for Beginners, including how it works, common signals, practical examples, advantages, limitations, and mistakes to avoid.
Welcome to JD Trading Zone
Many beginner traders spend most of their time studying price charts but completely ignore trading volume. This is one of the biggest mistakes new traders make.
Price tells you what is happening, while volume often tells you why it is happening.
Volume Price Analysis (VPA) is a trading approach that studies the relationship between price movement and trading volume. When you understand this relationship, you can identify stronger trends, avoid weak setups, and make more confident trading decisions.
Also check:- (Fake Breakouts vs Real Breakouts) (How to Trade Breakouts Successfully) (Best Candlestick Patterns for Intraday Trading) (100 Stock Market Terms Every Beginner Should Know) (Common Chart Patterns Every Trader Must Know)
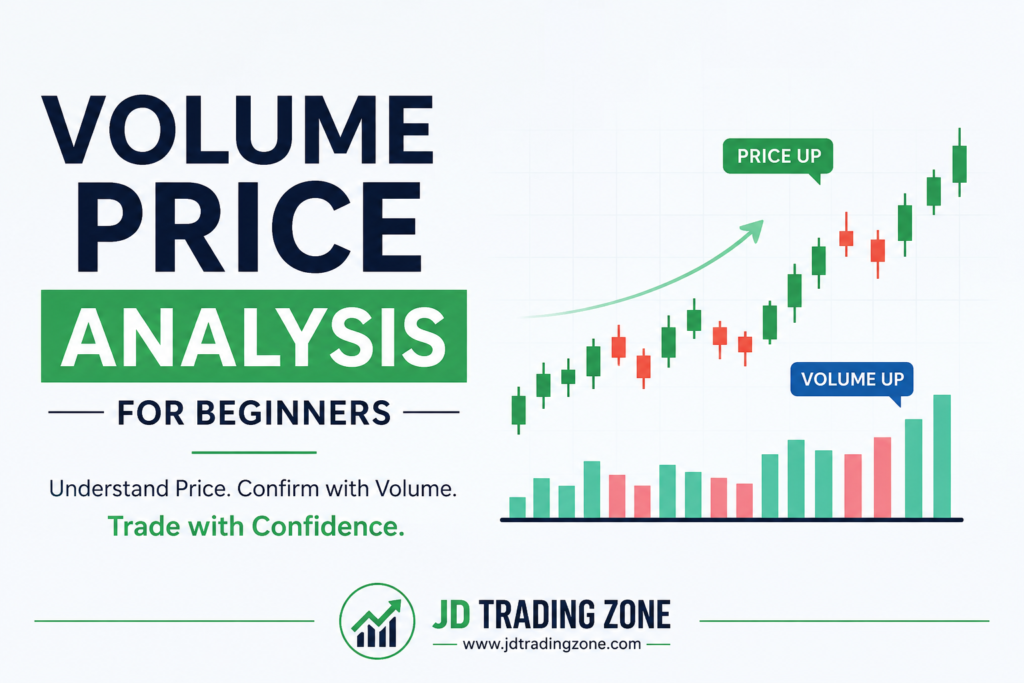
Volume Price Analysis (VPA) for Beginners
What is Volume Price Analysis?
Volume Price Analysis (VPA) is a method of analyzing the market by combining:
• Price movement
• Trading volume
• Market structure
Instead of looking at price alone, traders observe whether price movements are supported by strong or weak volume.
Think of volume as the fuel behind a market move.
• High volume = Strong participation
• Low volume = Weak participation
A price move supported by high volume is generally considered more reliable than one occurring on very low volume.
What is Trading Volume?
Trading volume represents the total number of shares, contracts, or units traded during a specific period.
For example:
• 10 lakh shares traded today = High volume
• 80,000 shares traded today = Lower volume
Every candlestick has a matching volume bar below the chart.
The higher the bar, the greater the trading activity.
Imagine a stock breaks above an important resistance level.
→ Scenario 1:
Price breaks resistance with huge volume.
• This usually indicates:
• Strong buying interest
• Institutional participation
Higher probability of trend continuation
→ Scenario 2:
Price breaks resistance with very low volume.
This may indicate:
• Weak buyers
• Lack of conviction
• Higher chance of a false breakout
This simple comparison explains why professional traders always monitor volume.
The Basic Rule of Volume Price Analysis
The main principle is simple:
Price and volume should agree with each other.
For example:
→ Rising Price + Rising Volume
This is usually bullish.
It suggests buyers are actively participating.
→ Rising Price + Falling Volume
This is a warning sign.
The uptrend may be losing strength.
→ Falling Price + Rising Volume
This indicates strong selling pressure.
The downtrend may continue.
→ Falling Price + Falling Volume
Selling pressure is weakening.
The market may soon stabilize or reverse.
Understanding Volume During Different Market Phases
1. Uptrend
Healthy uptrends usually show:
• Higher highs
• Higher lows
• Increasing volume during rallies
This confirms buyers remain in control.
2. Downtrend
Healthy downtrends usually show:
• Lower highs
• Lower lows
• Increasing volume during declines
This confirms sellers are dominating.
3. Sideways Market
During consolidation:
• Volume often decreases
• Buyers and sellers remain balanced
• Breakouts should ideally occur with strong volume
Important Volume Signals Every Beginner Should Know
1. Breakout with High Volume
One of the strongest VPA signals.
Example:
A stock trades between ₹500 and ₹520 for several weeks.
Suddenly it breaks above ₹520 with very high volume.
This suggests genuine buying interest.
2. Breakout with Low Volume
Be careful.
Without strong participation, many breakouts fail.
Always wait for confirmation.
3. Volume Spike
A sudden jump in volume often indicates:
• Important news
• Institutional buying
• Institutional selling
• Panic
• Profit booking
Do not trade solely because of a volume spike. Always analyze the price action as well.
4. Climax Volume
Sometimes volume becomes extremely high after a long trend.
Example:
A stock has rallied continuously for several weeks.
Suddenly volume becomes the highest in months while price struggles to move higher.
This may indicate buyers are becoming exhausted.
How Smart Money Uses Volume
Large institutions cannot buy millions of shares in one order.
Instead, they gradually accumulate positions.
This often creates:
• Rising volume
• Stable prices
• Strong support zones
Similarly, institutions distribute shares before major declines.
Volume Price Analysis helps traders recognize these activities.
How to Use VPA in Intraday Trading
For intraday traders, VPA can improve trade selection.
Example process:
Step 1
→ Identify important support and resistance.
Step 2
→ Wait for price to approach these levels.
Step 3
→ Observe the volume.
Step 4
→ If price breaks resistance with above-average volume, consider waiting for confirmation before entering.
Step 5
→ Place a proper stop-loss according to your trading plan.
Combining Volume with Other Indicators
Volume works best alongside price action and other tools.
Popular combinations include:
• VWAP + Volume
• EMA + Volume
• RSI + Volume
• Support & Resistance + Volume
• Trendlines + Volume
• Moving Averages + Volume
Using multiple confirmations can improve the quality of trade setups.
Common Mistakes Beginners Make
Ignoring Volume
→ Many traders enter trades solely based on candlestick patterns.
Volume adds valuable confirmation.
Trading Every Volume Spike
→ Not every spike leads to a trend.
Always consider the overall market structure.
Ignoring Market Context
→ A strong volume candle near resistance means something different than the same candle in the middle of a range.
Context matters.
Forgetting Risk Management
→ Even the best VPA setup can fail.
Always use:
• Stop-loss
• Position sizing
• Risk management rules
Advantages of Volume Price Analysis
• Easy to understand
• Works in stocks, futures, options, and commodities
• Helps confirm trends
• Filters false breakouts
• Improves entry timing
• Suitable for swing and intraday trading
• Works well with price action
Limitations of VPA
• Volume alone cannot predict the future.
• News events can change market direction quickly.
• False signals still occur.
• Requires practice and patience.
• Should not replace a complete trading strategy.
Simple Example
Suppose Stock ABC is trading around ₹1,000.
Day 1: Price moves to ₹1,010 on low volume.
Day 2: Price moves to ₹1,030 with very high volume.
The second move is generally stronger because more traders participated in it.
This is the basic concept behind Volume Price Analysis.
Tips for Beginners
• Study price before volume.
• Compare today’s volume with recent average volume.
• Focus on high-volume breakouts.
• Wait for confirmation instead of chasing trades.
• Keep a trading journal to review volume behavior.
• Practice on historical charts before risking real money.
Frequently Asked Questions (FAQs)
Is Volume Price Analysis good for beginners?
→ Yes. It is one of the simplest ways to understand whether price movements have strong market participation.
Can VPA predict market direction?
→ No. VPA helps improve probabilities but cannot guarantee future price movements.
Does VPA work in intraday trading?
→ Yes. Many intraday traders use volume to confirm breakouts, reversals, and trend continuation.
Is high volume always bullish?
→ No. High volume can indicate either strong buying or strong selling. Always analyze price direction together with volume.
Which markets support VPA?
→ Volume Price Analysis can be used in stocks, futures, commodities, ETFs, and other markets where reliable volume data is available.
Volume Price Analysis (VPA) for Beginners
Final Thoughts
Volume Price Analysis is one of the most practical skills a trader can learn. Instead of relying only on candlestick patterns, VPA helps you understand how strongly the market supports a price move.
Remember that no single indicator guarantees success. The best approach is to combine price action, volume, risk management, and discipline into a consistent trading plan.
If you’re just starting your trading journey, practicing Volume Price Analysis on historical charts can help you build confidence and make more informed trading decisions over time.
If this blog makes sense to you give your feedback in comments and stay tuned for more information about JD Trading Zone
Pingback: VWAP Trading Strategy Step by Step - jdtradingzone.com
Pingback: EMA Crossover Strategy Explained - jdtradingzone