
In this comprehensive guide, How to Trade Breakouts Successfully, including how to identify genuine breakouts, avoid false signals, manage risk, and improve your trading consistency.
Welcome to JD Trading Zone
Breakout trading is one of the most popular trading strategies used by beginners and professional traders alike. A successful breakout can lead to strong price movements and excellent trading opportunities. However, not every breakout leads to profits. Many traders lose money because they enter fake breakouts without proper confirmation.
Also check:- (Best Candlestick Patterns for Intraday Trading) (100 Stock Market Terms Every Beginner Should Know) (Common Chart Patterns Every Trader Must Know) (How to Analyze Volume in the Stock Market Like a Pro) (Top 10 Free Trading Tools Every Trader Should Use)
How to Trade Breakouts Successfully
What Is a Breakout in Trading?
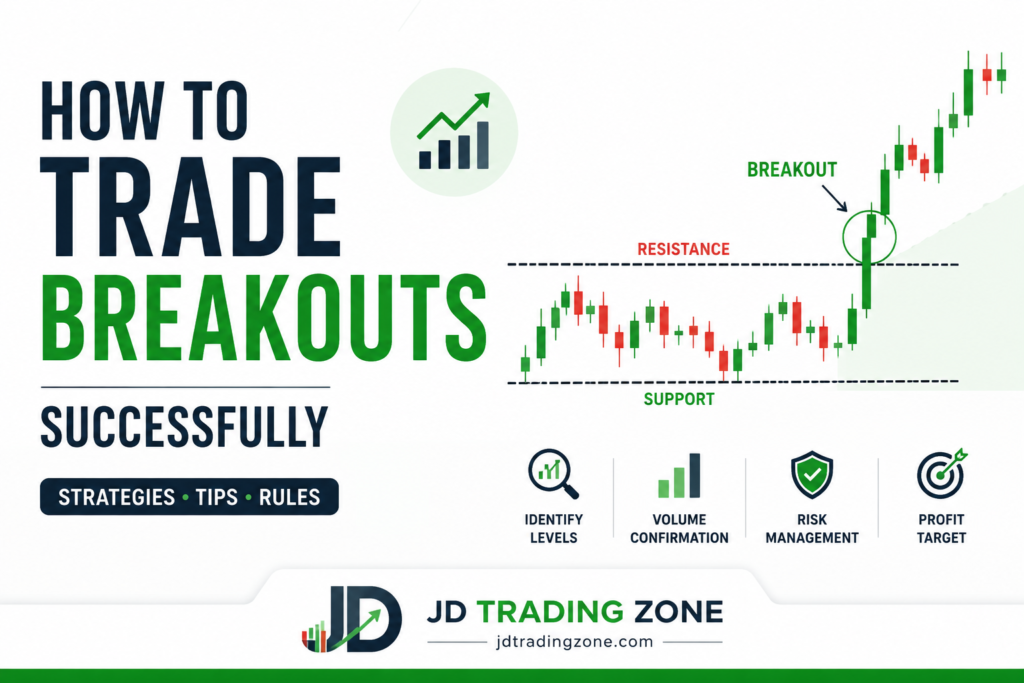
A breakout occurs when the price moves above a resistance level or below a support level with strong momentum. It indicates that buyers or sellers have taken control and that a new trend may be starting.
For example:
• Price breaks above resistance → Bullish breakout
• Price breaks below support → Bearish breakout
Breakouts often happen after a period of consolidation where buyers and sellers are in balance.
Why Do Breakouts Happen?
Breakouts occur because supply and demand become imbalanced.
Reasons include:
• Strong buying interest
• Heavy selling pressure
• Positive or negative news
• High trading volume
• Institutional participation
• Earnings announcements
• Economic data releases
When enough buyers or sellers enter the market, price escapes its previous trading range.
Types of Breakouts
1. Resistance Breakout
The price closes above a major resistance level.
Usually indicates bullish momentum.
Best suited for buying opportunities.
2. Support Breakdown
The price falls below an important support level.
Usually signals bearish momentum.
Suitable for short selling (where allowed).
3. Trendline Breakout
When price breaks a trendline that has held multiple times.
This often signals the beginning of a new trend.
4. Chart Pattern Breakout
Many chart patterns end with a breakout.
Examples include:
• Triangle
• Rectangle
• Flag
• Pennant
• Cup and Handle
• Ascending Triangle
• Descending Triangle
These patterns help traders anticipate potential price moves.
Why Volume Matters in Breakout Trading
Volume is one of the most important breakout confirmations.
A breakout with high volume usually has a greater chance of success because it shows strong market participation.
• Higher-than-average volume
• Strong candle body
• Closing near candle high
• Good follow-through in the next candle
Avoid breakouts that occur on very low volume.
How to Identify a Strong Breakout
Before entering a trade, check these conditions:
✅ Price closes above resistance
✅ Volume increases significantly
✅ Breakout candle has strong momentum
✅ Market trend supports the breakout
✅ No major resistance immediately ahead
The more confirmations you have, the higher the probability of success.
Trading Strategy
Step 1: Find Consolidation
Look for stocks trading in a narrow range.
Consolidation means buyers and sellers are balanced.
Eventually, one side wins.
Step 2: Draw Support and Resistance
Mark important price levels where the market has reacted multiple times.
These become potential breakout zones.
Step 3: Wait for Confirmation
Do not buy before the breakout.
Wait for:
• Candle close above resistance
• Strong volume
• Momentum confirmation
Patience prevents unnecessary losses.
Step 4: Enter the Trade
Aggressive Entry:
Buy immediately after the breakout candle closes.
Conservative Entry:
Wait for the breakout retest.
If price successfully retests resistance as support, enter the trade.
The retest method often reduces the chance of buying a false breakout.
Step 5: Place Stop Loss
Always use a stop-loss.
Common locations include:
• Below breakout candle
• Below support
• Below retest area
Never trade without a predefined exit plan.
Step 6: Set Profit Target
Popular methods include:
• Risk-to-reward ratio of at least 1:2
• Previous swing highs
• Measured move from the chart pattern
Trailing stop-loss to capture larger trends
Indicators That Help Confirm Breakouts
While price action is the primary tool, these indicators can provide additional confirmation.
→ Volume
Confirms trader participation.
→ VWAP
Useful for intraday traders.
Bullish breakouts above VWAP are generally stronger.
→ Moving Averages
The 20 EMA and 50 EMA can help confirm trend direction.
→ RSI
RSI above 50 often supports bullish momentum.
Avoid buying if RSI is showing bearish divergence.
→ MACD
A bullish crossover can strengthen breakout confidence.
Best Timeframes for Breakout Trading
→ Intraday
• 5-minute chart
• 15-minute chart
→ Swing Trading
• Daily chart
• 4-hour chart
→ Long-Term Investing
• Weekly chart
Choose a timeframe that matches your trading style.
How to Avoid False Breakouts
False breakouts are one of the biggest challenges in trading.
Here are some practical ways to reduce them:
• Wait for candle close instead of entering mid-candle.
• Look for above-average volume.
• Check the overall market trend.
• Avoid chasing overextended moves.
• Prefer breakout retests when possible.
• Be cautious during low-volume sessions.
No method is perfect, but combining these checks can improve trade quality.
Common Breakout Trading Mistakes
→ Buying Too Early
Many traders enter before confirmation.
Always wait for the breakout.
→ Ignoring Volume
Low-volume breakouts often fail.
→ No Stop Loss
A single bad trade can damage your account.
→ Chasing the Price
If price has already moved significantly after the breakout, waiting for a pullback may offer a better risk-to-reward setup.
→ Overtrading
Not every breakout deserves a trade.
Focus on high-quality setups.
Risk Management Rules
Good breakout traders focus on protecting capital.
Follow these guidelines:
• Risk only 1–2% of your trading capital per trade.
• Aim for a minimum 1:2 risk-to-reward ratio.
• Do not increase position size after a loss.
Avoid revenge trading.
• Keep a trading journal to review your trades.
Risk management is often more important than finding the perfect entry.
Example of a Bullish Breakout
Imagine a stock has been trading between ₹950 and ₹1,000 for several weeks.
Resistance is at ₹1,000.
One day:
• Price closes at ₹1,020.
• Trading volume is much higher than average.
• The next session, the price retests ₹1,000 and holds above it.
A trader enters near ₹1,005–₹1,015 after the successful retest, places a stop-loss below ₹1,000, and targets a move based on the chart structure or a favorable risk-to-reward ratio.
This is an example of waiting for confirmation rather than chasing the initial move.
Advantages of Breakout Trading
• Easy to understand
• Suitable for beginners
• Can capture strong trends
• Works in stocks, indices, forex, commodities, and cryptocurrencies
• Can be combined with price action and indicators
• Offers clear entry and exit points
Disadvantages of Breakout Trading
• False breakouts are common.
• Requires patience and discipline.
• Strong news events can create volatility.
• Late entries may reduce reward potential.
Understanding these limitations helps set realistic expectations.
Frequently Asked Questions (FAQs)
Is breakout trading good for beginners?
→ Yes. It is one of the easiest strategies to learn because support and resistance levels are straightforward to identify. Beginners should practice on historical charts or with a demo account before risking real money.
Which indicator is best for breakout trading?
→ There is no single best indicator. Many traders use Volume, VWAP, Moving Averages, RSI, or MACD as confirmation alongside price action.
Should I buy immediately after a breakout?
→ Buying immediately after confirmation is one approach. Waiting for a successful retest may provide a better risk-to-reward ratio and reduce the chance of entering a false breakout.
Can breakout trading be used for intraday trading?
→ Yes. Breakout strategies are widely used by intraday traders, especially during the first hour of the trading session when volume is often higher.
How can I reduce the chances of false breakouts?
→ Wait for a candle close beyond the breakout level, confirm the move with volume, trade in the direction of the broader trend, and avoid entering during low-liquidity periods.
How to Trade Breakouts Successfully
Final Thoughts
Breakout trading can be an effective strategy when approached with patience, discipline, and proper risk management. Rather than entering every price move, focus on high-quality setups confirmed by price action and volume. Over time, maintaining a trading journal and reviewing both successful and unsuccessful trades can help refine your decision-making.
Remember that no strategy guarantees profits. Consistent execution, sensible position sizing, and continuous learning are key to long-term success in the markets.
If this blog makes sense to you give your feedback in comments and stay tuned for more information about JD Trading Zone.
Pingback: Fake Breakouts vs Real Breakouts - jdtradingzone.com
Pingback: Volume Price Analysis (VPA) for Beginners - jdtradingzone.com