
Price action trading explained learn without indicator, and how beginners can start using it without depending on indicators.
Welcome to JD Trading Zone
Many beginner traders believe they need multiple indicators to become profitable. They fill their charts with RSI, MACD, Bollinger Bands, EMA, and several other tools. Instead of making trading easier, this often creates confusion.
Professional traders usually keep their charts simple. They focus on price action because price tells the real story of the market.
Also check:- (What is support and resistance? complete beginner guide) (Best Indicators for Intraday Trading in India) (How to Read Candlestick Charts for Beginners) (Complete beginners guidance about the stock market) (How to Use Pre-Market Data for Better Intraday Trades)
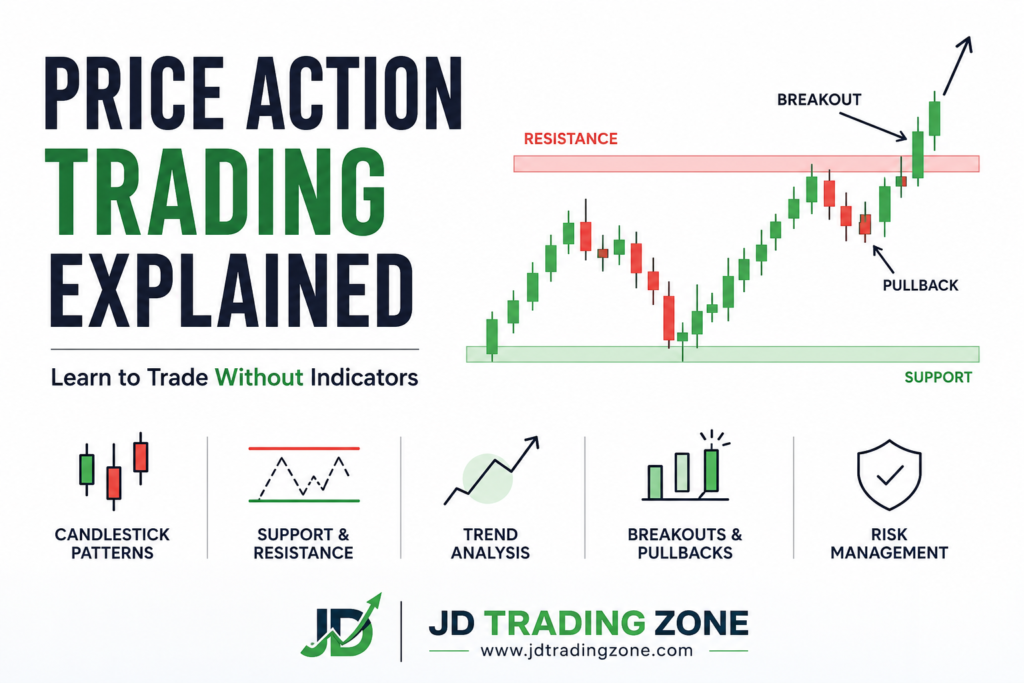
Price Action Trading Explained: Learn to Trade Without Indicators
Price action trading is a method of analyzing the market by studying price movements directly instead of relying on technical indicators.
The idea is simple:
Everything that affects the market is already reflected in the price.
Instead of waiting for indicators to confirm a move, price action traders observe:
• Candlestick patterns
• Market trends
• Support and resistance
• Breakouts
• Pullbacks
• Market structure
This helps traders understand what buyers and sellers are doing in real time.
Why Learn Price Action?
Price action is popular because it keeps trading simple and reduces unnecessary complexity.
• Benefits of Price Action Trading
• Clean and easy-to-read charts
• No indicator lag
• Better understanding of market psychology
• Works in stocks, forex, commodities, and cryptocurrencies
• Suitable for intraday, swing, and positional trading
• Helps traders make independent decisions
Many experienced traders use only a few drawing tools along with price action.
The Core Principle of Price Action
Every price movement happens because buyers and sellers are competing.
• When buyers dominate, prices move higher.
• When sellers dominate, prices move lower.
• When both are balanced, the market moves sideways.
Your job as a trader is to identify who is currently in control.
Understanding Market Structure
Before taking any trade, identify the market structure.
→ Uptrend
An uptrend forms when the market creates:
• Higher Highs (HH)
• Higher Lows (HL)
This indicates strong buying pressure.
Trading Idea
Look for buying opportunities during pullbacks.
→ Downtrend
A downtrend forms when the market creates:
• Lower Highs (LH)
• Lower Lows (LL)
This shows sellers are controlling the market.
Trading Idea
Look for selling opportunities after small upward pullbacks.
Sideways Market
Sometimes the market moves within a range.
During this phase:
• Buyers and sellers are balanced.
• Price keeps bouncing between support and resistance.
Beginners should avoid overtrading during low-volatility ranges.
What Are Support and Resistance?
Support is a price level where buyers usually enter and prevent prices from falling further.
Resistance is a level where sellers usually enter and stop prices from moving higher.
These levels help traders identify:
• Entry points
• Exit points
• Stop-loss placement
• Potential reversals
Never treat support and resistance as exact lines. Think of them as zones.
Candlestick Patterns Every Beginner Should Learn
Candlesticks provide valuable information about market sentiment.
1. Bullish Engulfing
A large bullish candle completely covers the previous bearish candle.
It often indicates buyers are gaining strength.
2. Bearish Engulfing
A large bearish candle covers the previous bullish candle.
It may signal increasing selling pressure.
3. Pin Bar
A pin bar has:
• Small body
• Long wick
It often represents rejection from an important price level.
4. Doji
A doji has a very small body.
It indicates market indecision.
Wait for confirmation before entering a trade.
5. Inside Bar
An inside bar forms when the entire candle stays within the previous candle.
It usually signals consolidation before a breakout.
Breakout Trading Using Price Action
A breakout occurs when price moves strongly above resistance or below support.
Good Breakout Characteristics
• Strong momentum candle
• High trading volume (if available)
• Clear close beyond the level
• Minimal rejection
Avoid entering immediately after a breakout. Wait for confirmation whenever possible.
Pullback Trading
Many beginners chase the market after a large move.
Professional traders often wait for a pullback.
Example:
• Stock breaks resistance
• Price returns to retest the breakout level
• Buyers step in again
• Price continues upward
This often offers a better risk-to-reward ratio.
Multiple Time Frame Analysis
Checking more than one timeframe helps improve decision-making.
Example:
• Daily Chart → Overall trend
• 1-Hour Chart → Trade setup
• 15-Minute Chart → Entry
Trading in the direction of the higher timeframe trend generally offers better probability.
How to Enter a Price Action Trade
A simple process:
Step 1
Identify the market trend.
Step 2
Mark important support and resistance zones.
Step 3
Wait patiently for price to reach those zones.
Step 4
Look for a strong candlestick confirmation.
Step 5
Enter only if the setup matches your trading plan.
Risk Management Is Essential
Even the best setups can fail.
Always:
• Risk only 1–2% of your capital per trade.
• Use a stop-loss.
• Avoid emotional trading.
• Don’t revenge trade after losses.
• Focus on consistency instead of quick profits.
Good risk management keeps you in the market long enough to improve.
Common Mistakes Beginners Make
Avoid these mistakes:
• Trading every candlestick pattern
• Ignoring the overall trend
• Entering without confirmation
• Moving stop-loss repeatedly
• Overtrading
• Taking trades out of fear of missing out (FOMO)
• Using excessive leverage
Discipline matters more than finding the “perfect” setup.
Can You Trade Without Indicators?
Yes.
Many successful traders trade using only:
• Price action
• Support and resistance
• Trend analysis
• Candlestick patterns
• Proper risk management
Indicators can be useful, but they should support your analysis—not replace your understanding of price.
Advantages of Price Action Trading
Beginner-friendly
• Works across different markets
• Improves chart-reading skills
• Reduces chart clutter
• Adaptable to different timeframes
• Encourages disciplined trading
Limitations of Price Action Trading
• Requires practice and patience
• No setup works 100% of the time
• Subjective interpretation of charts
• Emotional control is essential
• Beginners may struggle with false breakouts
Understanding these limitations helps set realistic expectations.
Tips to Learn Price Action Faster
• Practice on historical charts.
• Mark support and resistance daily.
• Observe trends before looking for entries.
• Keep a trading journal.
• Review winning and losing trades.
• Focus on quality setups instead of quantity.
• Start with a demo account before risking real money.
Consistent practice is the key to improvement.
Frequently Asked Questions (FAQs)
Is price action better than indicators?
→ Price action provides direct insight into market movements. Indicators can complement analysis, but many traders prefer using price action as their primary method.
Can beginners learn price action?
→ Yes. Beginners can start with market structure, support and resistance, and basic candlestick patterns before moving to advanced concepts.
Which timeframe is best for price action trading?
→ There is no single best timeframe. Swing traders often use daily and 4-hour charts, while intraday traders commonly use 15-minute, 5-minute, and 1-hour charts.
Does price action work in the Indian stock market?
→ Yes. Price action is widely used by traders in Indian stocks, futures, options, and indices such as Nifty and Bank Nifty.
Can I trade using only price action?
→ Yes, provided you have a clear trading plan, proper risk management, and sufficient practice.
Price action trading explained learn without indicator
Final words
Price action trading is not about predicting the future—it is about reading what the market is doing right now. By learning to identify trends, support and resistance, and high-quality candlestick patterns, you can make more informed trading decisions without relying on multiple indicators.
Remember that success in trading comes from discipline, patience, and consistent practice, not from finding a magical strategy. Build your skills gradually, manage your risk carefully, and focus on executing your trading plan consistently.
Pingback: Top 10 mistakes new traders make and how to avoid them - jdtradingzone.com
Pingback: Best Time Frame for Intraday Trading - jdtradingzone.com
Pingback: How to Choose Stocks for Intraday Trading Every Morning - jdtradingzone