
In this blog you will learn about, chart patterns complete beginners guidance in simple words and are beginners friendly.
If you want to become a successful trader in the stock market, learning chart patterns is a must. Chart patterns help traders understand market psychology, price direction, and possible future movement.
Whether you trade stocks, options, forex, or crypto, chart patterns work everywhere.
In this beginner’s guide, you will learn:
• What are chart patterns?
• Why chart patterns work
• Types of chart patterns
• Most important chart patterns with examples
• How to trade using chart patterns
• Common mistakes beginners make
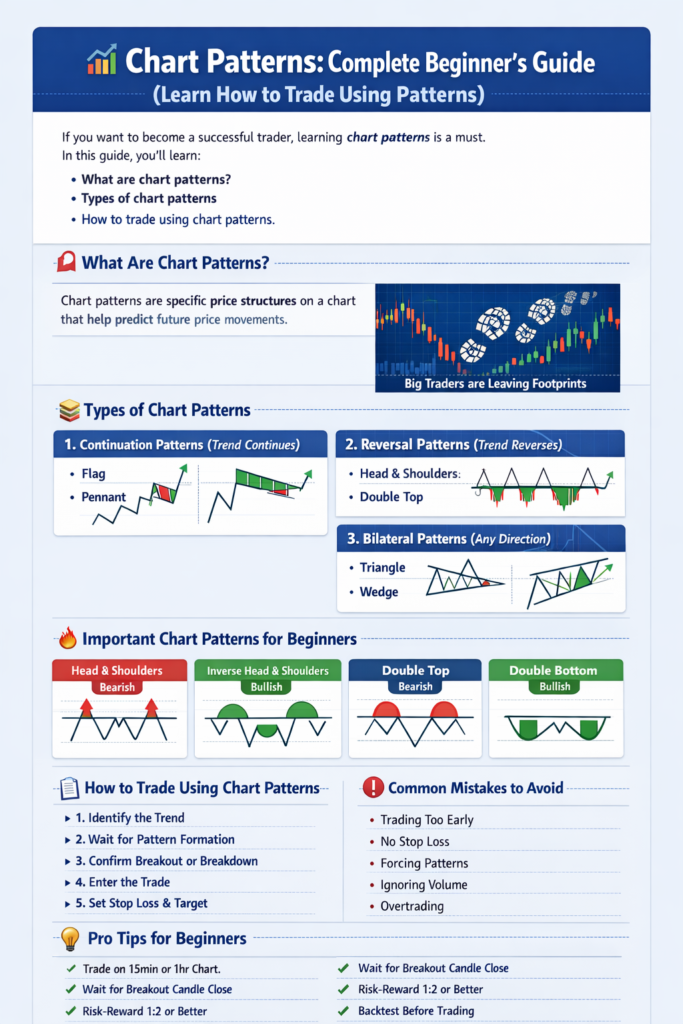
📌 What Are Chart Patterns?
Chart patterns are specific price structures formed on a price chart due to buying and selling pressure.
They help traders:
• Predict future price direction
• Find entry, stop loss, and target
• Understand trend continuation or reversal
Simply, chart patterns show what big traders are doing in the market.
🧠 Why Chart Patterns Work?
Chart patterns work because:
•Market moves based on human psychology
• Fear and greed repeat again and again
• Big institutions leave footprints on charts
•History repeats itself in price behavior
That’s why same patterns appear again and again in every market.
📚 Types of Chart Patterns
Chart patterns are mainly divided into 3 categories:
1️⃣ Continuation Patterns
These patterns indicate that the trend will continue after a small break.
Examples:
• Flag
• Pole & Flag
• Pennant
• Rectangle
2️⃣ Reversal Patterns
These patterns indicate that the trend may change direction.
Examples:
• Head and Shoulders
• Inverse Head and Shoulders
• Double Top
• Double Bottom
• Triple Top / Triple Bottom
3️⃣ Bilateral Patterns
These patterns can break in any direction.
Examples:
• Symmetrical Triangle
• Wedge
🔥 Most Important Chart Patterns for Beginners
1️⃣ Head and Shoulders (Bearish Reversal)
• Appears at market top
• Indicates trend change from bullish to bearish
• Structure: Left shoulder → Head → Right shoulder
• Breakdown happens below neckline
✅ Used to find sell or short trade
2️⃣ Inverse Head and Shoulders (Bullish Reversal)
• Appears at market bottom
• Indicates trend change from bearish to bullish
• Breakout happens above neckline
✅ Used to find buy trade
3️⃣ Double Top (Bearish Pattern)
• Price makes two highs
• Fails to break resistance
• Breakdown confirms trend reversal
4️⃣ Double Bottom (Bullish Pattern)
• Price makes two lows
• Fails to break support
• Breakout confirms trend reversal
5️⃣ Flag Pattern (Continuation)
• Strong move → small consolidation → breakout
• Trend continues in same direction
Very powerful in intraday and options trading.
6️⃣ Triangle Patterns
🔺 Ascending Triangle (Bullish)
• Flat resistance, higher lows
🔻 Descending Triangle (Bearish)
• Flat support, lower highs
🔸 Symmetrical Triangle
• Breakout can come either side
7️⃣ Rectangle Pattern
• Price moves between support and resistance
• Breakout gives big move
🧾 How To Trade Using Chart Patterns (Step-by-Step)
1. Identify the trend
2. Wait for pattern formation
3. Confirm with breakout or breakdown
4. Enter trade after confirmation
5. Place stop loss
6. Fix target using pattern height
🛑 Common Mistakes Beginners Make
❌ Trading before breakout
❌ Not using stop loss
❌ Forcing patterns on chart
❌ Ignoring volume confirmation
❌ Overtrading
📈 Best Indicators to Use With Chart Patterns
Since you already use VWAP, MACD, and Pivot Points, here is how to combine them:
• Use VWAP to confirm trend direction
• Use MACD to confirm momentum
• Use Pivot Points for support & resistance
• Enter only when pattern + indicator agree
💡 Pro Tips for Beginners
✔ Trade on 15min, 30min, 1hr timeframe
✔ Always wait for breakout candle close
✔ Use risk-reward minimum 1:2
✔ Focus on 1 or 2 patterns only
✔ Do backtesting before real money
⚠️ Are Chart Patterns 100% Accurate?
No ❌
→ But with proper risk management10 risk management rules every trader must follow, they can be highly profitable.
Trading is a game of probability, not guarantee.
(open a free demat account with zerodha)
🏁 Final Words
Chart patterns are the foundation of technical analysis. If you master:
• Support & Resistance
• Trend
• Chart Patterns
• Volume
You will become much better trader than 90% beginners.
If this blog makes sense to you give your feedback in comments and stay tuned.
At the end of the day
Trading isn’t about timing in the market it’s about time in the market.
Pingback: What is technical analysis in the stock market - jdtradingzone.com