In this blog you will learn about the pivots points explained.A simple guide for beginners, in simple words and beginners friendly stay tuned for updates.
Pivot point explained. A simple guide for beginners
Pivot point trading strategy – explained
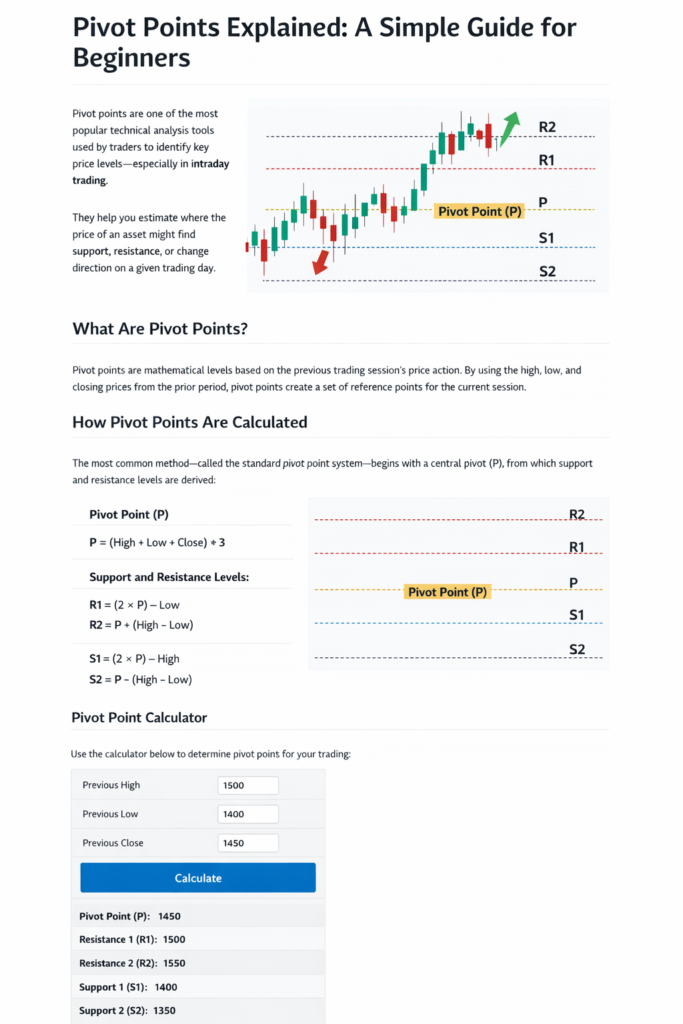
A pivot point in trading is a technical indicator used to identify potential support and resistance levels in the market.
In simple words:
It’s a price level that traders calculate from the previous day’s high, low, and close, and then use it to predict the next day’s trend.
How It works:
1} If the price is above the pivot point, it suggest bullish sentiment.
2} If the price bellow the pivot point, it suggest daring sentiment.
• R1, R2, R3 →Resistance levels
• S1, S2, S3 → Support levels
Example: If yesterday’s date for a stock is:
• High = 110
• Low = 100
• Close = 105
Then
Pivot = (110+100+105)÷3= 103 R1, R2, S1, S2 can be calculated from that.
How to use pivot point for buy signal:
1} check price vs pivot
• If price stays above the pivot point → Market is bullish.
• If price stays below pivot point → avoid buying.
2} Look at support & resistance levels
• Best buy entries often happen when price:
• Breaks above pivot with volume
• or bounces back from support and moves upward .
3} Confirmation with candles/
• Bullish candlestick above pivot.
Like green engulfing, hammer, or breakout candle.
4} Target and Stop loss
• First target: R1
• Second target: R2
• Stop loss: below pivot or nearest support.
Example:
Pivot = 100
- Price breaks above 100 and stays there with volume.
- Buy entry triggered.
- Target 1= R1 (103)
- Target 2= R2 (106)
- Stop loss = 99 just below pivot.
In simple words:
Above pivot= Look for buy
Below pivot= Look for sell
How to use pivot point for selling.
1} Check Price vs pivot
- If price is below the pivot point → Market sentiment is bearish.
- Avoid selling if the price is staying above pivot
2} Look at resistance & support levels.
- Best sell entries happen when price.
- Breaks below pivot with volume.
- Or retest resistance and rejects, then falls down.
3} Confirmation with candles
- Bearish candlestick near pivot or R1/R2.
Like red engulfing, shooting star, breakdown candle .
4} Targets and stop loss.
- First target: s1
- Second target: s2
- Stop loss: Just above pivot or nearest resistance.
Example:
Pivot= 200
- Price falls below 200 stays there with volume.
- Sell entry triggered.
- Target 1= s1
- Target 2= s2
- Stop loss = 203.
In simple word
Below pivot= sell signal.
Above pivot= buy signal.
How to use pivot points in the real market
1} Market pivot levels before the market opens.
- Calculate or use you charting software to automatically plot pivot s1,s2,R1, R2.
- These act like maps for the trading days.
2} Observe opening price.
- If price opens above pivot → market bias= bullish.
- If price opens below pivot → market bias → bearish.
3} Wait for price action confirmation.
- Don’t jump aht open . Let candles form near pivot, R1 or S1.
- Watch for bounce or rejection.
4} Take entry.
- Buy setup: Price holds above pivot or breaks R1 with volume
- Sell setup: Price falls below pivot or gets rejected at R1/R2 .
5} Set target & stop loss.
- Target= next pivot levels.
- Stop loss= just beyond the opposite level.
Example in live market
Let’s say nifty has:
- Pivot= 20,000
- R1 = 20,100
- S1= 19,900
If the market opens at 20,000
- If price breaks 20,100 with volume → buy
- Target=20,200
- Stop loss = below 20,000 pivot.
Extra Confirmation
Using Vwap indicator with pivot point for extra Confirmation
1} Market check
- Vwap= tells you the intraday trend.
- Pivot Point= tells you key support resistance zones.
- Price above Vwap+ above pivot=bullish.
- Price below Vwap+ below pivot= Bearish.
2} Buy setup
- Price holds above pivot.
- Price also trading above Vwap.
- Confirm with a bullishullish candle/ macd crossover.
- Target= R1/ R2
- Stop loss = Below Vwap or pivot
3} Sell setup.
- Price stays below Pivot.
- Price also trading below Vwap.
- Confirm with a bearish candle/ macd crossover down.
- Target= s1/ s2
- Stop loss= above Vwap or pivot.
4} Advanced trick
- If Vwap and pivot are near the same level that zone becomes a super strong support/ resistance.
- Price rejecting there gives high probability entries.
Example
Pivot= 200
Vwap= 202
- Price falls below both
- Sell entry triggered.
- Target= s1
- Stop loss = 204
Using RSI indicator with pivot point for extra Confirmation.
1} Market bias with pivot.
- Above pivot= look for buy setup.
- Below pivot= sell signals.
2} Buy setup RSI+pivot
- Price is above pivot
- RSI is near 40-50
- If Rsi bounces upward and price holds Pivot or S1 → strong buy signal.
- Target= R1/ R2.
- Stop loss = just below pivot or S1.
3} Sell setup.
- Price is below pivot.
- RSI is near 50-60.
- If Rsi turns down and price rejects pivot or R1 → strong sell signal.
- Target= s1/ s2.
- Stop loss = just above pivot or R1.
4} Overbought/ oversold confirmation.
- If the price is near R1/r2 and RSI>70 – possible reversal → look for sell.
- If the price is near s1/s2 and RSI<30 – possible reversal → look for buy.
Example
Pivot= 100
- RSI= 45 → not overbought, still soon to go up.
- Price bounces from pivot.
- Target= R1
- Stop loss = 99
Is the pivot point really good for intraday trading.
1} clear levels before the market opens
- You already know about pivot s1, s2 R1,R2 before trading starts.
- Saves time- you don’t have to guess support resistance during the session.
2} Market Sentiment Indicator.
- Price above pivot → bullish signal.
- Price below pivot → bearish signal.
- This gives you a quick read on the day’s trend.
3} Perfect for target & stop loss
- Trades often book profits at pivot levels.
- You get predefined risk/ reward zones.
5} Works in All markets
- Stocks, index, forex , crypto – pivot point work everywhere.
- In sideways/ choppy market, pivot points alone may give false signals.
- Always confirm with Vwap, rsi, or price action.
Pivot Point explained . A simple guide for beginners, it is really good for intraday but best when used with another indicator for confirmation.
( pivots points explained. A simple guide for beginners)
Important things to notice in the real market.
- Avoid trading in the first 5- 10 mins .
- Respect stop loss.
- Manage your risk management.
Tips
- Use RSI on 5- min or 15- min time frame on charts for intraday.
- Avoid trades when RSI is stuck in the middle without trend.
- RSI divergence near pivot levels= powerful signal.
Pros & Cons of Pivot Points ( Pivot points explained. A simple guide for beginners)
Pros
✔ Easy to calculate and understand
✔ Useful for short-term traders
✔ Works across markets (stocks, forex, commodities)
Cons
✘ Not foolproof — price can break through levels without reversing
✘ Less effective in strongly trending markets without additional indicators
Conclusion
Pivot points are a simple but powerful tool that help traders determine key levels of support and resistance based on historical price data. Used correctly — and combined with other signals — they can improve your entry, exit, and risk management decisions in intraday trading.
If this strategy makes sense to you try applying it in your next trade and share, your results in the comments .
In the next blog i will share how i use Macd with a pivot point together to find high probability intraday setups – stay tuned.
At the end of the day
Trading is not about timing in the market – it’s about time in the market.
- What is price action analysis?In this guide, you will learn,What is price action analysis,How it works,Important concepts,Best strategies for beginners. Introduction Price Action Analysis is one of the most powerful and simple trading methods in the stock market. Instead of using many indicators, price action focuses only on price movement, candlesticks, and chart structure to make trading decisions. Professional… Read more: What is price action analysis?
- Importance of consistency and discipline in tradingIn this blog you will learn about the importance of consistency and discipline in trading, in simple words and beginners friendly. In the stock market, many traders search for the perfect indicator, secret strategy, or guaranteed setup. But the truth is — most successful traders don’t win because of indicators, they win because of consistency… Read more: Importance of consistency and discipline in trading
- How to start intraday trading In India with small capitalIn this blog you will learn about how to start intraday trading in India with small capital, simple words and beginners friendly stay tuned for more information. Intraday trading is one of the most popular ways to earn money from the stock market in India. Many beginners think they need a lot of money to… Read more: How to start intraday trading In India with small capital
- What is technical analysis in the stock marketIn this guide you will learn about what is technical analysis in the stock market, in simple words and beginners friendly. If you want to become a successful trader or investor, you must understand technical analysis. It is one of the most important skills used by traders to predict price movements and find profitable trading… Read more: What is technical analysis in the stock market
- What is Support and Resistance & Supply and Demand in stock marketIn this blog you will learn about, what is support and resistance & supply and demand in stock market,stay tuned for more information. If you want to become a profitable trader, you must understand Support & Resistance and Supply & Demand zones. These concepts are the backbone of technical analysis and are used by banks,… Read more: What is Support and Resistance & Supply and Demand in stock market
Pingback: Best time frame for intraday trading with pivot point - jdtradingzone.com
See my latest post Pivots points explained.A simple guide for beginners. here is full beginners guidence