In this guide, you will learn,What is price action analysis,How it works,Important concepts,Best strategies for beginners.
Introduction
Price Action Analysis is one of the most powerful and simple trading methods in the stock market. Instead of using many indicators, price action focuses only on price movement, candlesticks, and chart structure to make trading decisions.
Professional traders around the world use price action because it is:
• Clean
• Fast
• Works in all markets (Stocks, Forex, Crypto)
• Perfect for intraday trading
What is price action analysis?
Price Action Analysis is the study of pure price movement without using indicators.
It means:
• You analyze candlestick patterns
• You observe support and resistance
• You understand trend direction
• You trade based on market behavior, not indicators
In simple words: Price tells everything — you just need to learn how to read it.
Why price action is important in trading?
🔹 Why Price Action is Important in Trading?
Here are the main benefits:
✅ No lag like indicators
✅ Works in all timeframes (1 min, 5 min, 15 min, daily)
✅ Works in all markets
✅ Clean and simple charts
✅ Better entry & exit timing
✅ Best for intraday and options trading
🔹 Core Concepts of Price Action Trading
1️⃣ Support and Resistance
These are the most important levels where:
• Price takes support and moves up
• Price faces resistance and moves down
Price action traders always:
• Buy near support
• Sell near resistance
2️⃣Trend Structure
There are 3 types of trends:
• 📈 Uptrend (Higher High, Higher Low)
• 📉 Downtrend (Lower High, Lower Low)
• ➡️ Sideways / Range
Rule: Always trade in the direction of the trend
3️⃣ Candlestick Patterns in Price Action
Some powerful price action candlestick patterns:
• Hammer
• Shooting Star
• Doji
• Engulfing Pattern
• Inside Bar
• Pin Bar
These patterns show buyer and seller psychology.
Important Price Action Patterns
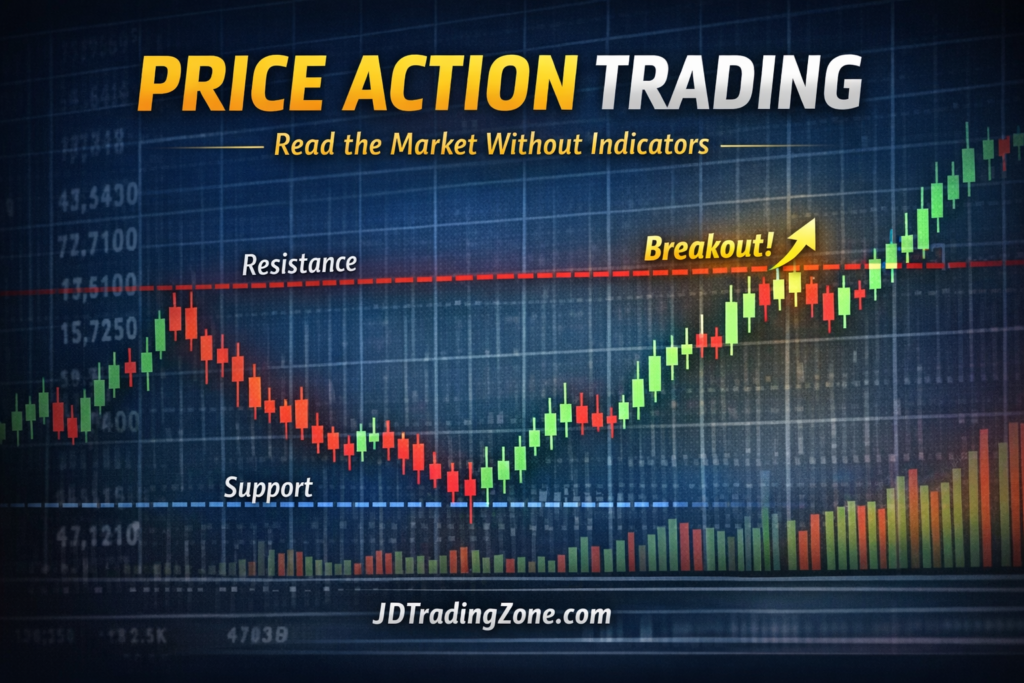
✔️ Breakout & Breakdown
• When price breaks resistance → Breakout
• When price breaks support → Breakdown
Always wait for:
• Retest
• Confirmation candle
✔️ False Breakout (Fakeout)
→ When price breaks a level and comes back inside, trapping traders.
→ This is one of the best opportunities in price action trading.
🔹 How to Do Price Action Analysis Step-by-Step
1. Mark Support & Resistance
2. Identify Trend Direction
3. Wait for Price Action Signal
4. Check Confirmation
5. Place Stop Loss
6. Define Target
🔹 Best Timeframe for Price Action in Intraday Trading
• 5 minute chart → Entry
• 15 minute chart → Trend & levels
• 1 minute chart → Scalping (advanced)
🔹 Price Action + VWAP + Pivot Points (Powerful Combo)
Since you already trade using these, use price action like this:
✅ Buy near Pivot / VWAP support with bullish candle pattern
✅ Sell near Pivot / VWAP resistance with bearish candle pattern
✅ Avoid trades in no-trade zone
This improves:
• Accuracy
• Risk-reward
• Win ratio
🔹 Risk Management in Price Action Trading
Never forget:
• ❌ Don’t overtrade
• ✅ Risk only 1–2% per trade
• ✅ Always use Stop Loss
• ✅ Follow Risk:Reward = 1:2 or 1:3
🔹 Common Mistakes Beginners Make
• Trading without trend
• Trading every candle
• No stop loss
• Overconfidence
• Ignoring support & resistance
🔹 Is Price Action Enough for Trading?
Yes! Many professional traders trade using only price action.
But for better accuracy, you can combine:
• Price Action + VWAP
• Price Action + Pivot Points
• Price Action + Volume
🔹 Conclusion
Price Action Analysis is a must-learn skill for every trader. It teaches you:
• How market really moves
• How big players think
• When to enter and exit
If you master price action, you don’t need 10 indicators.
If this blog makes sense to you give your feedback in comments and stay tuned.
At the end of the day
trading isn’t about timing in the market it’s about time in the market.
В случае если вы ищете прямые рейсы из Еревана в Европу или иные направления, стоит присмотреться на аэропорты черногория, литва, Польши и Болгарии — оттуда постоянно летают привлекательные lowcost рейсы. Очень выгодно искать бюджетные авиабилеты из Москвы за границу, принимая во внимание горящие предложения и lowcost варианты, например, в Чехию, Новую Зеландию или Доминикану. Для организации поездки рекомендуется проверить возможности по направлениям и аэропортам на аэропорты оаэ , где без проблем смотреть сразу и прямые рейсы, и самые дешевые билеты.
Дополнительно, если вам нужны дешевые авиабилеты из Ташкента, Анталии или Берлина, не теряйте из виду про известные аэропорты Израиля, ОАЭ и Англии. Эти дестинации нередко предлагают очень привлекательные тарифы и low cost варианты. А если интересует, куда недорого слетать из Москвы или куда есть непересадочные рейсы из Тель-Авива, стоит изучить аэропорты Норвегии и Португалии — там можно обнаружить действительно экономные варианты для отдыха и путешествий.
Pingback: What is an ETF in the stock market? - jdtradingzone.com