In this blog you will learn about best time frame for intraday trading with pivot point, in simple words and beginners friendly stay tuned for more information.
Intraday trading is all about making quick decisions and capitalizing on short-term price movements. One of the most popular tools used by day traders is Pivot Points, because they provide objective levels of support and resistance that are fixed for the trading day.
Pivot Points are calculated using the previous trading session’s high, low, and close prices and then applied to your charts for the current session.
Best time frame for intraday trading
Best time frame for intraday trading
What is the time frame?
→ time frame means the duration of each candle on your trading chart.
Example :
- 1- minute time frame → each candle shows 1 minute of price movements.
- 5- minutes time frame → each candle shows 5 minutes of price movements.
- 15- minutes time frame → each candle shows 15 minutes of price movements.
So, the time frame decides how much market data each candle represents and how detailed or smooth your chart looks.
What are the pivots points?
→ Pivot point is a technical indicator used to find possible support and resistance levels for the day.
It’s a calculator using the previous days high low and close prices.
Traders use it to identify where the price is night reverse or face breakout during intraday trading.
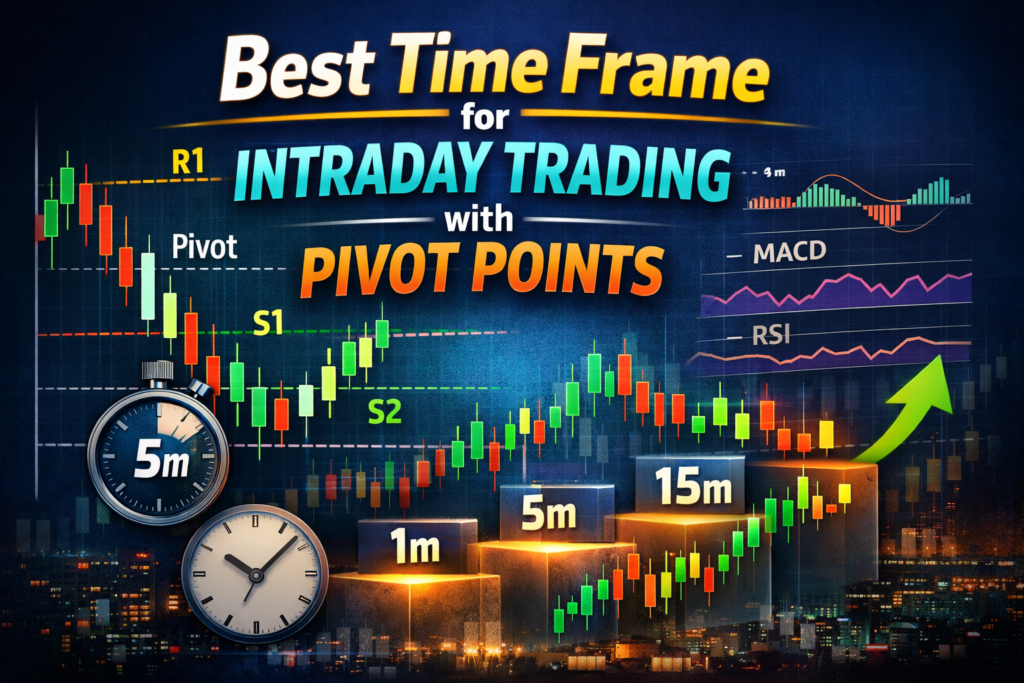
Best time frame
5- minutes or 15- minutes charts – ideal for most intraday traders.
→ 5- minute chart
- Good for quick entries/exits
- Helps you catch moves between pivot levels.
- Works best in high – volume indices like bank nifty or Nifty 50.
→ 15- minute charts
- Smoother and more reliable signals.
- Filters out small noise and fake breakouts.
- Ideal for holding trades for 30-90 minutes.
Support time frame
- 1- minute chart for precise entries/ exits near pivot levels.
- 1- hour chart to check overall trend direction for the day bias- bullish or bearish.
Best time frame according to trading style
- Trading style
- Scalping
- Intraday
- Positional/ swing trading
- Long term – investing
2. Holding time
- Few seconds to minutes
- A few minutes or hours
- 1-5 days
- Weeks to months
3. Best time frame
- 1- min or 3- min chart
- 5- min or 15- min chart
- 1-hour or 4- hours chart
- Daily or weekly chart
→ For ultra – short trades. Catch quick moves between pivot levels. Need fast decision and tight stoploss.
→ Most popular far pivot point strategy. Gives clear signals with lass noise.
→ Focus on big moves . Pivot Point helps find weekly support resistance.
→ used for trend direction and key long- term support resistance.
What is the role of Time frame in intraday trading
What is the role of Time frame in intraday trading
- Define candle duration: each time frame decides how much market data one candle shows – e.g 1- min candle= 1 minute of price action 5- min candle= 5 minutes of price action.
- Control chart detail
- Smaller time frame: show more detail quick signal, but also more noise.
- Higher time frame: smoother chart , fewer fake signals good for trend confirmation.
3. Affect entry and exit timing
Your entry and exit depend on which time frame you follow.
- Scalpers enter on 1- min or 3- min charts.
- Intraday traders use 5- min or 15- min for precise entries exits.
4. Help match trading style:
→ Different trades have different patience levels and risk appetites the time frame lets you trade according to your comfort.
5. Improve accuracy when combined
Using multiple time frames together helps you:
- Trade with trends not against it.
- Avoid false breakouts.
If you don’t care about the time frame, here’s what happens.
- You’ll get confused signals.
- Each time frame tells a different story.
- Without time frame alignment you’ll get mixed signals and false entries.
2. Wrong entry and exit timing
- You might enter too early or too late because you’re not matching the right time frame to your trade style.
- For example
-on a 1- min chart a small pullback looks big.
-on a 15- min chart it’s nothing.
→ this confusion can lead to loss or a missed project.
3. No control over risk & stoploss
- Stoploss and target depend on candle size.
- If you ignore the time frame your stoploss might be too small or too big for your position – increasing your risk.
4. You’ll trade randomly
- Without a fixed time frame your analysis becomes inconsistent.
- One day you’ll use 1- min next day 15- min and results will vary wildly.
→ The time frame is your trading foundation. Without it even a good strategy fails.
If you fix your time frame your strategy becomes:
- Consistent
- Easy to backtest
- Easier to trust emotionally.
Real trading profile
- How long do you usually hold a trade ?
- Less than 5 minutes
- 5-30 minutes
- 30 minutes or a few hours.
2. How much screen time do you give daily for trading?
- Full day
- Only 2-3 hours
- Less than 1 hour.
3. Do you prefer more trades or fewer but bigger trades.
- More trades
- Fewer trades
Time management rules in trading
- Trade only in active hours.
- Avoid the first 15 minutes after the market opens – high volatility no direction.
- Fix your screen time – don’t state alk day: plan entries and exit.
- Set trade duration – know when to exit win or lose.
- Avoid revenge trading – if you miss , wait for the next setup.
- Review daily trades-spend 10-15 min after market close to learn.
- Stick to one time frame – don’t keep switching during live trades.
→ Use 5- minutes charts for entries exits.
→ Use 15- minute charts to confirm the main trend ( for intraday).
→ Avoid trading during the first 15 minutes after the market opens- let direction settle.
→ Don’t trade between 12:30-1:30 pm – low volume zone.
→ Focus on managing your time.
→ The time frame is really important in the type of trading.
Final Takeaway
There’s no single “perfect” timeframe — but here’s a simple rule of thumb:
✔ For most traders: start with 5-minute and 15-minute charts for pivot point trading. �
✔ Scalpers may prefer 1-minute charts, while longer-term day traders benefit from higher timeframes to confirm overall trend. �
Pivot points are most effective when used in conjunction with price action and other indicators — not in isolation.
If this strategy makes sense to you give your feedback in comments.
In the next blog i will share about how to trade banknifty options using vwap.
At the end of the day
trading isn’t about timing in the market it’s about time in the market.
- What is price action analysis?In this guide, you will learn,What is price action analysis,How it works,Important concepts,Best strategies for beginners. Introduction Price Action Analysis is one of the most powerful and simple trading methods in… Read more: What is price action analysis?
- Importance of consistency and discipline in tradingIn this blog you will learn about the importance of consistency and discipline in trading, in simple words and beginners friendly. In the stock market, many traders search for the perfect… Read more: Importance of consistency and discipline in trading
- How to start intraday trading In India with small capitalIn this blog you will learn about how to start intraday trading in India with small capital, simple words and beginners friendly stay tuned for more information. Intraday trading is one… Read more: How to start intraday trading In India with small capital
- What is technical analysis in the stock marketIn this guide you will learn about what is technical analysis in the stock market, in simple words and beginners friendly. If you want to become a successful trader or investor,… Read more: What is technical analysis in the stock market
- What is Support and Resistance & Supply and Demand in stock marketIn this blog you will learn about, what is support and resistance & supply and demand in stock market,stay tuned for more information. If you want to become a profitable trader,… Read more: What is Support and Resistance & Supply and Demand in stock market
Pingback: How to use Vwap with RSI for more accurate trades - jdtradingzone.com
Pingback: Macd Indicator - how to use it in Intraday Trading. - jdtradingzone.com
Pingback: Top 5 trading apps in India - jdtradingzone.com
Pingback: How to start intraday trading In India with small capital - jdtradingzone.com