In this blog you will learn about the what is Vwap in stock market, in simple words and beginners friendly. Stay tuned for more information.
Introduction
If you are an intraday trader, you must have heard about VWAP. VWAP is one of the most powerful and widely used indicators by professional traders, institutions, and smart money.
VWAP (Volume Weighted Average Price) helps traders understand:
• The true average price of a stock
• Whether price is expensive or cheap
• The trend direction
• High-probability entry and exit levels
In this article, you will learn:
• What VWAP is
• How VWAP works
• How to use VWAP in intraday trading
• Best VWAP trading strategies
• VWAP with RSI & MACD
• Advantages & limitations of VWAP
Vwap trading strategy
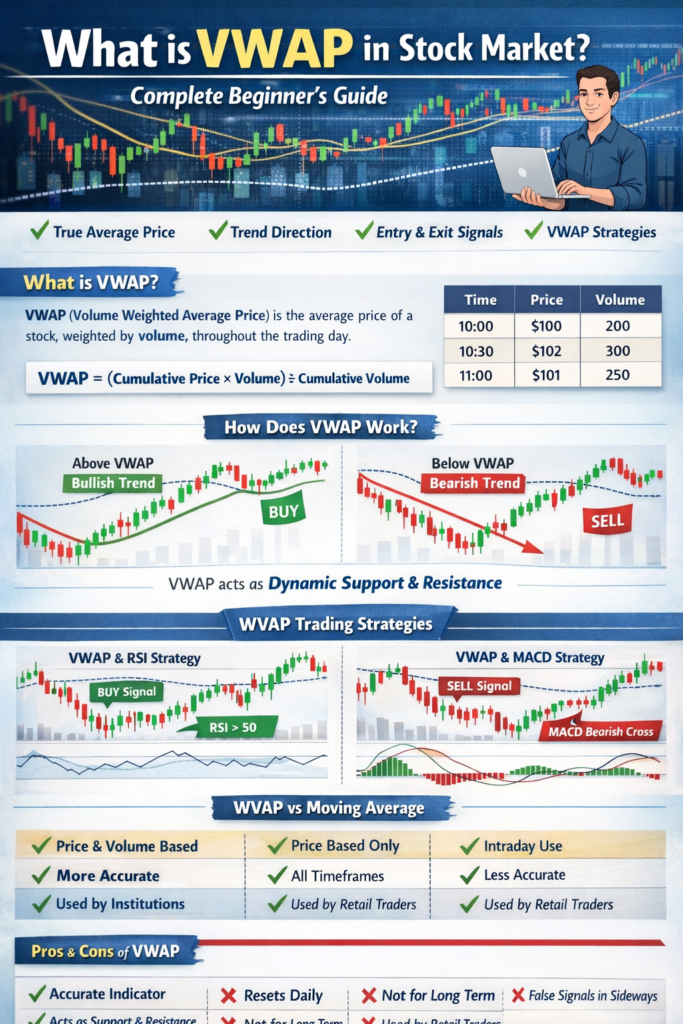
VWAP= Volume Weighted Average.
Good for Intraday Trading.
It is an indicator in the stock market that traders use to confirm buying or selling decision .
Vwap formula
VWAP = (Cumulative Price × Volume) ÷ Cumulative Volume
How to use VWAP in Trading ( What is Vwap in stock market)
1} Intraday Buy signal..
Using VWAP as a Bullish indicator
• If the stock price crosses above VWAP
– buyers are stronger
• VWAP acts as support in uptrend.
Entery Point
• Enter when price bounces up from VWAP.
exit point
• Stop loss – Just below VWAP or according
to your risk reward ratio.
Example : XYZ Stock opens at 100
VWAP is 98
Price goes up to 101
Then folls back near VWAP
and then bounces up from Rs.98 to
100 Rs
= Bullish signal
But at Rs.99 –100 stop – loss at Rs.97.
2} Intraday sell signal..
Using VWAP as a Selling Indicator
• If the stock price falls below VWAP – sellers
are stronger
• VWAP acts like resistance in downtrend.
Entery Point
•Enter when price falls below VWAP.
Exit point
• Stop – loss Just above VWAP or according to
Your risk reward ratio
Example: XYZ Stock at Rs. 100
VWAP is Rs. 102
Price tries to rise to Rs. 102 but fails to
break VWAP then drop to 99 Rs
=Bearing signal
Short at Rs. 99 stop – loss 101.
How to use Vwap in real market
1} chart setup
• Open your trading platform
( Upstox , Zerodha , trading view ect .)
• select 5 – min or 15 min time frame in chart
• Add VWAP indicator from indicator list
2} Market opening
• Avoid trading in first 30 min price is too
volatile
• let VWAP line settle
3} Identify trend with VWAP
• price above VWAP – bullish signal
• price below VWAP – bearing signal
Example : If nifty is trading at 19,800 and VWAP is 19,750 – since price – VWAP , Market is bullish
4} Entery Point
• Bullish trade : wait for price to touch VWAP
and bounce upward
→ sell near VWAP
5} Exit / stop loss
• Target : Nearest resistance / support or
0.5% – 1% move.
• Stop – loss: Just on the opposite side of
VWAP.
• If long trade – Stop – loos below VWAP
•If short trade – Stop above VWAP
6} End of Day
• VWAP resets daily. Don’t carry forward
VWAP analysis to next day
Extra confirmation
• use RSI indicator with VWAP for extra
Confirmation.
→What is RSI ?
RSI = Relative Strength Index
The RSI is a momentum indicator in
technical analysis.
It tells you whether a stock is over bought
or over sold.
How traders use RSI
1} over bought (sell signal)
If RSI > 70 → possible correction or reversed .
2} Over sold (Buy signal)
If RSI < 30 – possible bounces or reversal
upward .
3} Trend confirmation:
• RSI > 50 → bullish trend .
• RSI < 50 → bearing trend.
Example :
• stock price rises from Rs. 100 – Rs. 120.
• RSI jumps to 75
Means stock is overbought → may pull back.
• Later stock falls to Rs. 90.
• RSI drops to 25 means stock is oversold → may bounce upward.
How to use VWAP with RSI
1} Setup
• Chart : 5- min or 15- min for intraday.
• Add VWAP indicator.
• Add RSI
• Condition 2: RSI is above 50 but below
70
2} Bullish Trade Setup
• Condition 1: Price is above VWAP→
buyers are stronger.
• Entry: Buy when price pulls back near
Vwap and RSI stays above 50.
• Exit target resistance or 1 – 2 % move.
• Stop loss : Just below VWAP.
Example: Stock is Rs. 100 , VWAP = Rs. 98 , RSI=55
Price bounce from VWAP →enter at Rs. 99
Stop – loss Rs. 97 , target Rs.102.
3} Bearish Trade setup.
• Condition 1: Price is below VWAP → Seller
are stronger.
• Condition 2 : RSI is below 50 but above 30.
• Entry: sell / When price touches VWAP and
falls again, RSI stays below 50.
• Exit : Target support or 1 – 2% move.
• Stop – loss : Just above VWAP.
Example: stock is Rs. 200, VWAP= Rs. 205, RSI= 45
Price rejects VWAP at Rs. 204 – enter short
Stop – loss Rs. 206, Target Rs. 195
4} Extra confirmation.
• If RSI crosses above 70 while price > VWAP
→avoid fresh buying.
• If RSI crosses below 30 while price < VWAP
→avoid fresh selling.
In short
• Price > VWAP + RSI > 50 = Buy.
• Price < VWAP + RSI < 50 = sell.
How to use VWAP with MACD ( What is Vwap in stock market)
1} Setup
• Chart: 5 – mint or 15 for Intraday
• Add VWAP indicator.
• Add MACD
2} Bullish trade setup
• Condition 1: Price is above VWAP
→ bullish signal.
• Condition 2: MACD line crosses above Signal
line (Bullish crossover)
• Entry: When crossover happenes and price
is holding above VWAP
• Exit: Target previous resistance or 1 – 2 %
move.
• Stop – loss : Below VWAP.
Example: Stock at Rs. 500, VWAP = Rs. 495, MACD
Crossover at Rs. 501
→ Buy near Rs. 501 – 503, stop – loss Rs. 494, target Rs. 515.
3} Bearish Trade setup
• condition 1: Price is below VWAP
→ bearish signal
• condition 2: MACD line crosses below signal
line ( bearing crosses )
• Entry: When crosses happened and price is
staying below VWAP.
• Exit Target support zone or 1–2 % move.
Stop – loss : above VWAP.
Example: Stock at Rs. 300 , VWAP= Rs. 305, MACD Crossover at Rs. 299.
→short at Rs. 299 – 300,
Stop – loss Rs. 306 Target 290
4} Avoid false signal
• If MACD crosses happened but price is
hugging VWAP ( sideway) → ignore trade.
• Best traders happen when VWAP and MACD
both agree on direction.
In short
• Buy: price > VWAP+MACD Bullish crossover.
• sell: price < VWAP+MACD Bearish crossover.
Is VWAP really good for Intraday.
Advantages of VWAP for IntradayHow to trade banknifty options using vwap
1} True Average price
• VWAP shows where most traders actually
bought / sold
• Better than just a moving average.
2} Dynamic support/ resistance
• price often reacts around VWAP→ good for
entry/ exit
3} Institutional benchmark
• Big funds are VWAP to avoid moving
market.
• If price is for above VWAP, institutions wait
to buy lower
4} Trend signal
• price above VWAP →bullish signal
• price below VWAP → bearish signal
Limitation of VWAP ( what is Vwap in stock market)
1} Intraday only
• VWAP resets every day.
• Not useful for multi day or swing position.
2} Lagging Indicator
• VWAP is average → reacts slowly in first
move .
• You may miss part of the move if you wait
for confirmation.
3} sideways market problem
• If stock is range – bound, price keeps
crossing VWAP → gives false signals .
When VWAP works best
• Trading stocks.
• High → volume stocks / indexes
• combined with other indicators
When VWAP fails
• Low volume or illiquid stocks.
• Choppy sideway market.
In reality
Yes, VWAP is very good for Intraday, but only if .
• you combined it with another indicator
• you avoid sideways markets
• you use proper Stop–loss.
Important things to notice ( What is Vwap in stock market)
1} VWAP resets daily.
It’s not very useful for multi day analysis but is very powerful for Intraday Trading.
Pro tips.
Combined VWAP with RSI < 50 for stronger signals.
Important tips for real market
• Don’t trade every time price tovcher VWAP
→ Wait for clear bounce or rejection.
• Avoid during sideways market .
• Practice in paper trading first before using real money .
🏁 Conclusion
VWAP is one of the most powerful intraday trading indicators that helps you:
• Identify trend
• Find high-probability entries
• Avoid bad trades
• Trade like professional traders
For best results, always use VWAP with confirmation indicators like RSI, MACD, Pivot Points or Price Action and follow strict risk management.
❓ FAQ
1.Is VWAP good for intraday?
✅ Yes, VWAP is specially designed for intraday trading.
2. Can beginners use VWAP?
✅ Yes, it is very simple and beginner-friendly.
3. Which timeframe is best for VWAP?
✅ 5-minute and 15-minute charts are best.
Vwap trading strategy.
If this strategy market sense to you try applying it in your results in the comments.
In the next blog , I’ll share how I use VWAP and pivet points together to find high – probability Intraday setup – stay tuned.
It the end of the day,
Trading isn’t about timing the market – it’s about time in the market
- Real Reasons Traders Lose Money mistakes to avoidIf you’re a beginner, understanding real reasons traders lose money mistakes to avoid can save you from costly errors and help you build a sustainable trading journey. Many people enter trading with big dreams—quick profits, financial freedom, and a better lifestyle. But the reality is harsh: most traders lose money, especially in the beginning. The good news?These losses are not random. They happen because of specific, repeated mistakes. Also check:- ( option trading strategy with low risk)… Read more: Real Reasons Traders Lose Money mistakes to avoid
- Best intraday trading strategy for stocksThis guide will help you understand simple, practical, and beginner-friendly best intraday trading strategy for stocks that actually work—along with risk management rules that professionals follow. Intraday trading is one of the most popular ways to make money in the stock market—but it’s also one of the easiest ways to lose money if you don’t follow a proper strategy. Many beginners enter the market with high expectations and no clear plan. The result? Emotional decisions, unnecessary losses,… Read more: Best intraday trading strategy for stocks
- How to start stock market investing in IndiaIf you are new, don’t worry. This guide will walk you through how to start stock market investing in India step by step in a simple and practical way. Investing in the stock market is one of the most effective ways to build long-term wealth. In India, with increasing digital access and awareness, more people are entering the market—but many beginners still feel confused about where to start. Also check:- ( what is future and option) (… Read more: How to start stock market investing in India
- How to make your own strategy in tradingIn this guide, you will learn how to make your own strategy in trading step by step, even if you are a beginner. Trading in the financial markets can be exciting, but without a clear plan it often becomes risky and emotional. Many beginners start trading by copying strategies from others, but the most successful traders eventually build their own trading strategy that fits their personality, capital, and risk tolerance. What is a trading strategy? What Is… Read more: How to make your own strategy in trading
- Rules of options trading for beginnersIf you are new to options trading, rules of options trading for beginners, this blog can help you manage risk, make better decisions, and develop discipline. In this guide, we will explain the most important rules every beginner should follow before entering the options market. Options trading has become increasingly popular among retail traders because it allows investors to participate in the stock market with relatively small capital. However, options are complex financial instruments and without proper… Read more: Rules of options trading for beginners
Can you help me for training best strategy
Pingback: Top 5 scalping strategies for beginners - jdtradingzone.com
Ok I will make this post soon
Pingback: How to trade banknifty options using vwap - jdtradingzone.com
See my latest post What is Vwap in Stock market?
Pingback: Macd+ Vwap combo strategy for better accuracy. - jdtradingzone.com
Pingback: How to control emotions while trading. - jdtradingzone.com
Pingback: Types of trading in the stock market - jdtradingzone.com
Pingback: Macd Indicator - how to use it in Intraday Trading. - jdtradingzone.com
Pingback: What is Fibonacci retracement? - jdtradingzone.com
Pingback: What is the volume in trading? - jdtradingzone.com
Pingback: Best intraday trading strategy for stocks - jdtradingzone.com