
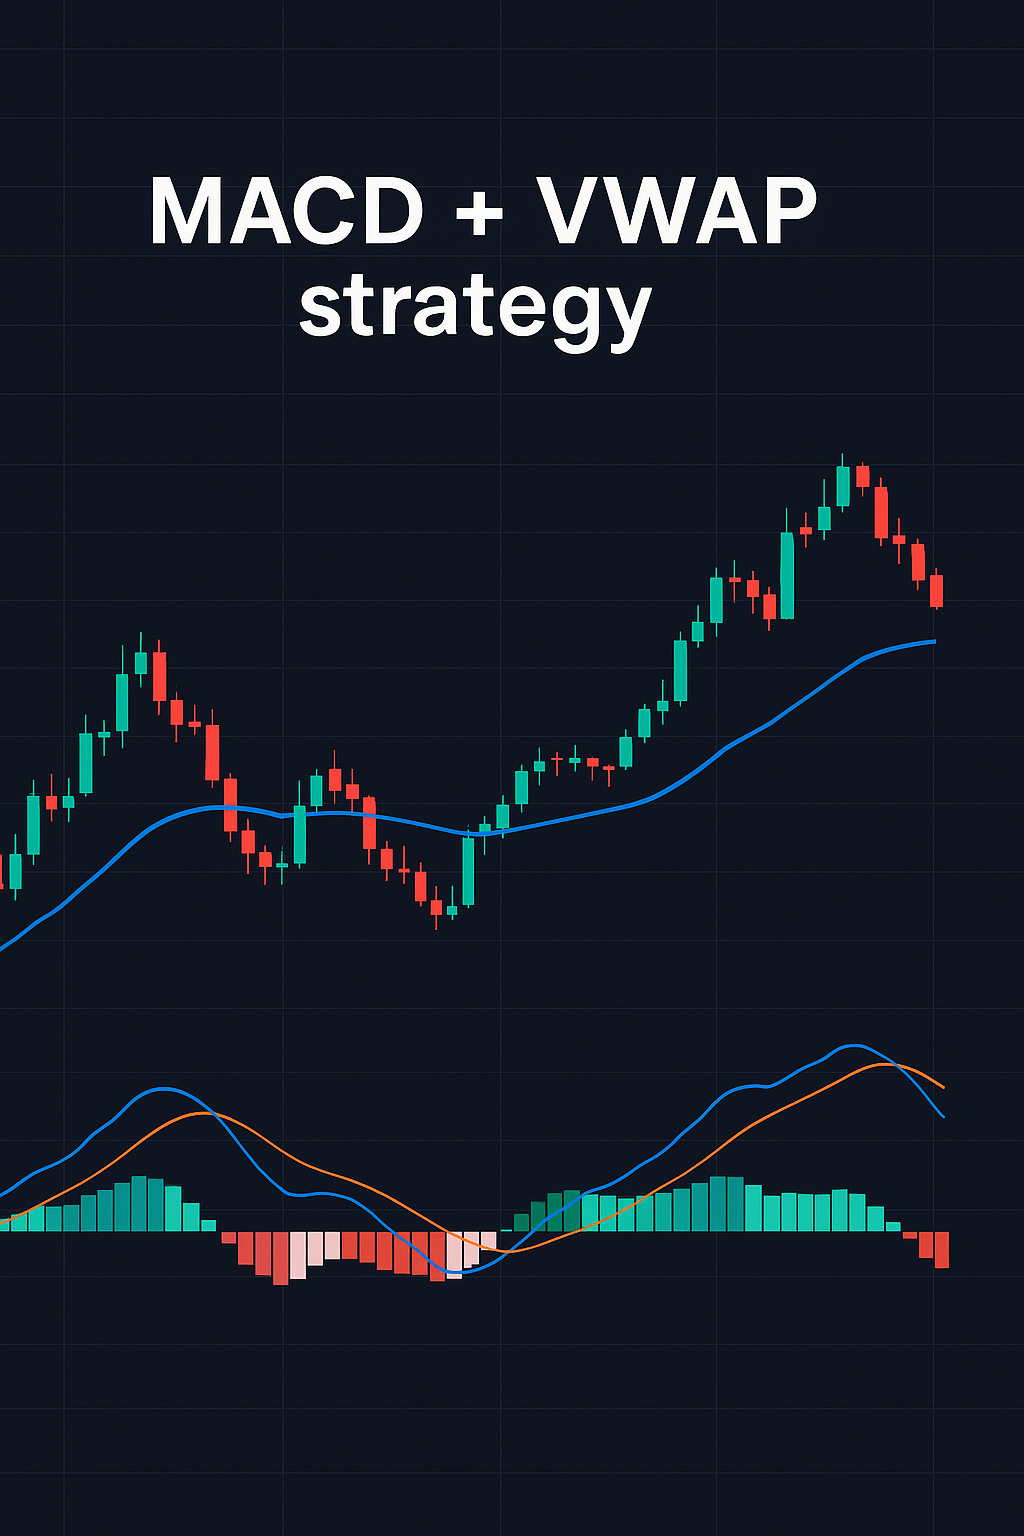
In this blog you will learn about macd + Vwap combo strategy for better accuracy, in simple words and beginners friendly stay tuned for more information.
Vwap macd trading strategy
Volume weighted average price.
It shows the average price of a stock throughout the day weighted by volume.
In simple words –
Vwap tells you the average price big traders are buying or selling at.
→ how to read Vwap.
- Price above Vwap – bullish control
- Price below Vwap – bearish control.
- Flat Vwap – sideways market avoids trading.
→ Why Vwap is useful
- Acts as a dynamic support resistance
- Shows institutional trends.
- Helps you buy near Vwap in an uptrend sell near Vwap in the downtrend.
- Great for intraday confirmation with other indicators like Macd or other indicators.
Vwap formula
Vwap= sum of price × volume ÷ total volume
Macd= moving average convergence divergence.
It’s a trend+ momentum indicator that shows when stocks momentum is shifting from bearish to bullish or bullish to bearish.
Main parts
- Macd line= 12 Ema – 26 Ema
- Signal line= 9 Ema of macd line
- Histogram= difference between Macd line and signal line.
How to read Macd
- Macd line crosses above signal line → buy bullish crossover.
- Macd line crosses below signal line → sell bearish crossover.
- Histogram rising → momentum increasing.
- Histogram shrinking → momentum weakening.
Best use
- Confirm trend direction and momentum.
- Works best when combined with Vwap or pivot point for entry confirmation.
Macd+ Vwap combo strategy
Macd + Vwap combo strategy
Macd + Vwap combine strategy
- Indicator setup
- Vwap: default setting for intraday.
- Macd: 12,26,9 default.
- Chart timeframe: 5- min for entries, 15-min for trend confirmation.
- Buy setup
- Price above Vwap → bullish trend confirmed.
- Macd line crosses above signal line → momentum turning positive.
- Macd histogram turns green → rising strength.
- Candle closes above Vwap with volume confirmation.
- Entry → after the candle closes above Vwap Macd crossover confirmed.
- Exit → when price closes back below Vwap or Macd shows bearish crossover.
- Sell setup
- Price below Vwap → bearish signal.
- Macd line crosses below signal line → momentum turning negative.
- Macd histogram turns red
- Candle closes below Vwap
- Entry → after a bearish candle close below Vwap and Macd crossover confirmed.
- Exit → when the price closes above Vwap or Macd gives a bullish crossover.
Filters for better accuracy
- Trade only with market trends use 15- min chart macd to confirm trends before entering on 5- min.
- Avoid the first 5-10 min of the market open.
- Avoid sideways Vwap.
- Use pivot point or previous day high/low as targets.
How to use it in a live market
Setup before the market opens.
→ Timeframe: 5-min chart
→ Indicators:
- Vwap – default intraday?
- Macd- 12, 26, 9 default
- Optional: 15-min chart for higher trend direction
In live market
- Identify trend with Vwap
- Price above Vwap → bullish signal looks for calls.
- Price below Vwap → bearish signal look for puts.
- Vwap flat → sideways.
- Wait for Macd confirmation
- For buy: Macd line crosses above signal line and histogram turns green.
- For sell: Macd line crosses below signal line and histogram turns red.
- Don’t enter just on Vwap or Macd alone – wait for both to align.
- Confirm with candle close
- Enter only after a candle closes
- Above Vwap+ bullish Macd crossover buy.
- Below Vwap+ bearish macd crossover sell.
- Set entry, stop – loss and target
- Entry 48000- after a bullish crossover above Vwap.
- Stoploss below Vwap.
- Target= next support resistance level or 100-150 points.
- Manage position.
- Exit if price crosses back over Vwap in the opposite direction.
- Or Macd gives reverse crossover.
- Partial profit booking when histogram starts shrinking.
→ Above Vwap+ Macd bullish= buy.
→ Below Vwap+ Macd bearish= sell.
How to check the accuracy of this strategy
- Backtest your strategy
- Forward test
- Trade live on paper for 7-10 days.
- Follow the checklist exactly.
- Track each trade result in the same Excel sheet.
- You’ll see real – time performance emotional control.
- Measure risk reward ratio.
- Even if accuracy is 50% it can still be profitable if your average reward is double your risk.
- Use journal sheet
- Date time symbol Vwap direction Macd signal entry sl target result rr comment.
- Accuracy benchmark
- Market type
- Trending days
- Sideways days
- Mixed days
- Expected accuracy
- 70-85%
- 40-55%
- 60-75%
- Notes
- Vwap clearly sloping
- Avoid flat Vwap
- Moderate success.
- Common mistakes that reduce accuracy
- Entering before the candle closes.
- Ignoring higher time frame trends.
- Trading during news spikes .
- Not following stoploss.
- Market type
Backtest → forward test – record → refine
This is how you get your real accuracy % and not just guess it .
If this strategy makes sense to you give your feedback in comments.
In the next blog I will share about the best discount brokers in India stay tuned.
At the end of the day
trading isn’t about timing in the market it’s about time in the market.
- What is price action analysis?In this guide, you will learn,What is price action analysis,How it works,Important concepts,Best strategies for beginners. Introduction Price Action Analysis is one of the… Read more: What is price action analysis?
- Importance of consistency and discipline in tradingIn this blog you will learn about the importance of consistency and discipline in trading, in simple words and beginners friendly. In the stock… Read more: Importance of consistency and discipline in trading
- How to start intraday trading In India with small capitalIn this blog you will learn about how to start intraday trading in India with small capital, simple words and beginners friendly stay tuned… Read more: How to start intraday trading In India with small capital
- What is technical analysis in the stock marketIn this guide you will learn about what is technical analysis in the stock market, in simple words and beginners friendly. If you want… Read more: What is technical analysis in the stock market
- What is Support and Resistance & Supply and Demand in stock marketIn this blog you will learn about, what is support and resistance & supply and demand in stock market,stay tuned for more information. If… Read more: What is Support and Resistance & Supply and Demand in stock market