
Most beginners look at volume only after entering a trade.
They see a breakout, click Buy, and then notice that the volume suddenly looks weak. A few candles later, the breakout fails.
I made the opposite mistake when learning intraday trading.
I started treating every large volume bar as a signal. A big green volume bar meant “buyers are coming,” while a big red bar meant “sellers are attacking.” It looked simple on the chart, but it was not.
The problem is that volume tells you how much activity occurred, not automatically who is going to win the next move.
That small distinction changed how I started reading volume.
Today, before taking an intraday trade, I don’t ask:
“Is volume high?”
I ask:
“Is the volume supporting the price action
I am about to trade?”
That is a much more useful question.
Also check:- (Best Time to Trade in the Indian Stock Market) (Why Good Trading Setups Fail: 9 Reasons Behind Losing Trades) (One Complete Intraday Trading Setup) (How to Choose Stocks for Intraday Trading in India)
What Does Volume Actually Tell You?
Volume represents the quantity of shares or contracts traded during a particular period. A trade occurs when buyers and sellers match, so volume should not be interpreted as “buy volume + sell volume” as two separate quantities. Zerodha’s educational material gives the same basic explanation of how traded quantity contributes to volume.
For an intraday trader, volume can help answer questions such as:
• Is the stock actively being traded?
• Is a breakout attracting participation?
• Is a price move happening with little participation?
• Is a pullback losing momentum?
• Is a support or resistance level attracting activity?
• Is the current move stronger or weaker than recent candles?
NSE also provides security-wise price, volume, value and other trading statistics, showing how volume is a core part of market activity data.
But there is one important rule:
Never use volume alone to decide an entry.
Price structure comes first. Volume helps you judge the quality of that structure.
The Biggest Volume Mistake Beginners Make
Imagine a stock breaks above ₹500.
The volume bar is much larger than the previous few candles.
A beginner sees this:
Large volume = Buy
But that’s incomplete.
The better question is:
Where did that large volume appear, and what did price actually accomplish with it?
Suppose the stock trades heavily between ₹500 and ₹503 but closes the candle at ₹500.50.
There was a lot of activity, but price did not make much progress.
That is very different from a candle that breaks ₹500 and closes strongly around ₹506 with increased participation.
So I prefer to think about volume using this simple concept:
Volume = Effort
Price movement = Result
When the effort is large but the result is poor, I become cautious.
When strong volume produces a clean price movement through an important level, I pay more attention.
This approach is much more useful than simply watching whether the volume bar is green or red.
Step 1: Look at Volume Before Looking for an Entry
Before entering an intraday trade, first look at the stock’s recent volume.
Don’t compare today’s volume with some random stock.
Compare the current volume with recent candles of the same timeframe.
For example, if you are trading on a 5-minute chart, compare the current 5-minute volume with recent 5-minute candles.
The goal isn’t to find a perfect number.
The goal is to identify a change in participation.
Step 2: Don’t Use a Fixed “High Volume” Number
One of the most common questions is:
“How much volume is considered high?”
There isn’t one universal answer.
A volume of 5 lakh shares may be huge for one stock and insignificant for another.
Even the same stock can have very different volume patterns during different parts of the trading session.
Instead of saying:
“Volume above 10 lakh is high.”
I prefer:
“Is today’s current volume unusually strong compared with recent candles at a similar point in the session?”
You can also use a simple volume moving average as a reference.
For example:
20-period average volume
If the current volume is significantly above that average, it tells you that activity has increased relative to the recent baseline.
But remember:
Above-average volume does not automatically mean a good trade.
It simply tells you that something is happening.
You still need to determine what is happening.
Step 3: Read Volume With Market Structure
This is where volume becomes much more useful.
Suppose a stock has resistance at ₹1,000.
You are waiting for a breakout.
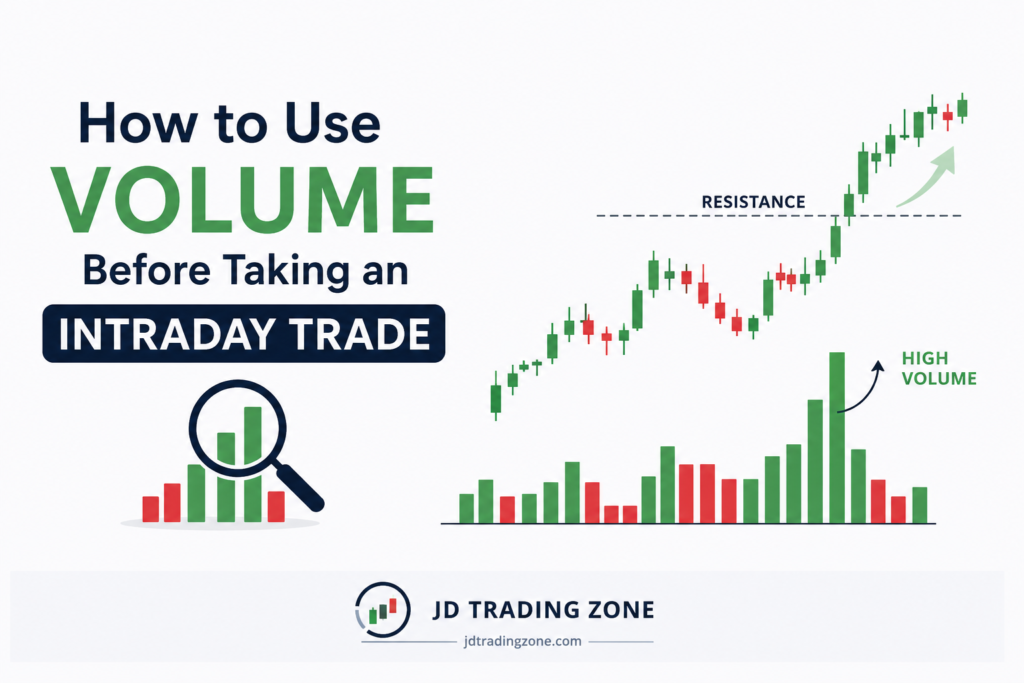
Scenario A: Strong breakout
Price reaches ₹1,000.
The candle breaks above resistance.
Volume expands.
The candle closes near its high.
The next candle holds above ₹1,000.
This combination is much more interesting.
Why?
Because price has actually achieved something important while participation increased.
Scenario B: Weak breakout
Price crosses ₹1,000.
Volume is average or below average.
The candle has a long upper wick.
Price closes back below ₹1,000.
This is a completely different situation.
The fact that price temporarily crossed ₹1,000 doesn’t make it a confirmed breakout.
The volume and candle behaviour are warning you to slow down.
Step 4: Use Volume to Validate Breakouts
Breakout trading is one of the easiest places to use volume.
Before entering a breakout trade, ask five questions:
1. Was there a clearly visible level?
2. Did price actually break that level?
3. Did volume expand around the breakout?
4. Did the candle close convincingly?
5. Did price hold the breakout area afterward?
If most answers are yes, the breakout deserves attention.
If the only positive point is that price briefly crossed the level, I would not call it a strong breakout.
Example
Imagine this sequence:
₹490 → ₹495 → ₹498 → ₹500 resistance
Price spends several candles below ₹500.
Then a candle breaks to ₹504.
Volume rises considerably compared with recent candles.
The candle closes around ₹503.50.
Instead of buying immediately at the first tick above ₹500, a trader could wait for confirmation according to their strategy.
One possible approach is to see whether price holds the ₹500–₹502 area.
This reduces the temptation to chase the first breakout candle.
Step 5: Low Volume Can Be More Useful Than High Volume
This is something beginners often overlook.
Suppose a stock is moving upward.
The initial breakout happens with strong volume.
Then price starts pulling back.
During the pullback, volume gradually decreases.
Price remains above the breakout level.
That behaviour can be more encouraging than a pullback accompanied by aggressive volume.
Why?
Because the retracement is occurring with less participation.
For example:
Breakout: High volume
Pullback: Lower volume
Support holds: Positive observation
This does not guarantee that the stock will rise.
But it gives you a much more structured setup to evaluate.
Step 6: Watch What Happens When
Volume Increases During a Pullback
Now imagine the opposite.
Price breaks upward.
Then it starts falling back toward support.
Instead of volume decreasing, several strong bearish candles appear with expanding volume.
That deserves caution.
The sellers are showing more participation during the retracement.
You don’t need to predict what happens next.
Simply recognize that the original long setup has become less attractive.
This is one of the biggest advantages of using volume:
It can tell you when NOT to trade.
And avoiding poor trades is a major part of intraday trading.
Step 7: Understand the Difference Between Volume and Volume Color
Many charting platforms display volume bars in green and red.
Beginners often assume:
Green volume = buying
Red volume = selling
That interpretation is too simplistic.
Volume measures completed transactions.
It does not independently tell you that every share in a green bar represents aggressive buying or every share in a red bar represents aggressive selling.
The important information comes from combining:
Volume + candle + price location + market structure
For example:
A huge-volume candle near resistance with a long upper wick deserves a different interpretation from a huge-volume candle breaking cleanly above resistance.
The volume number might be similar.
The price behaviour is completely different.
Step 8: Use Volume Around Support and Resistance
Volume becomes especially interesting near important price levels.
Let’s say a stock has support at ₹750.
Price falls from ₹780 to ₹752.
At ₹750–₹752, a large volume spike appears.
But the candle closes near ₹758 instead of breaking below support.
That tells you that significant activity occurred around the support zone.
It does not automatically mean “Buy.”
Instead, you can wait for price confirmation.
For example:
Support → Volume spike → Rejection → Bullish confirmation
This is a much more logical trade sequence than:
Support → Volume spike → Buy immediately
Step 9: Don’t Ignore the Opening Volume
The first part of the Indian market session can be unusually active.
News, overnight global moves, institutional orders and reactions to previous-day events can create large early volume.
Therefore, comparing the first 5-minute candle with an ordinary midday 5-minute candle can be misleading.
A massive opening volume bar isn’t automatically a special signal.
Instead, ask:
• Is the opening move continuing?
• Is price holding the opening range?
• Is volume remaining supportive?
• Is the move immediately reversing?
• Is the stock moving with the broader market?
This is particularly useful when combining volume with an Opening Range Breakout (ORB) approach.
Step 10: Use Relative Volume Instead of Just Raw Volume
Raw volume tells you how many shares or contracts traded.
Relative volume gives you a more useful comparison.
For a simple intraday approach, you can compare:
Current volume ÷ average recent volume
For example:
Current 5-minute volume = 300,000 shares
Average recent 5-minute volume = 150,000 shares
Relative volume:
300,000 ÷ 150,000 = 2
So the current candle traded at roughly 2× the recent average volume.
That doesn’t mean the trade is automatically valid.
It means participation is considerably higher than the recent baseline.
Now you can ask:
What did price do with that participation?
That’s the important part.
A Simple Volume Checklist I Use Before an Intraday Entry
Before taking a trade, run through this checklist:
1. Where is price?
Is it near:
• Support?
• Resistance?
• Previous high?
• Previous low?
• VWAP?
• Opening range?
• Day’s high/low?
2. What is volume doing?
Is it:
• Increasing?
• Decreasing?
• Average?
• Suddenly spiking?
3. What is price doing?
Is price:
• Breaking?
• Rejecting?
• Consolidating?
• Pulling back?
• Reversing?
4. Is volume supporting the move?
This is the most important question.
5. Is the trade already extended?
High volume after a huge move doesn’t necessarily mean you should enter.
Sometimes the best volume signal is simply:
“I’m late. Don’t chase.”
Three Volume Situations Every Intraday Trader Should Recognize
Situation 1: Breakout + Strong Volume
Price: Breaks resistance
Volume: Expands
Candle: Strong close
Follow-through: Holds above resistance
Interpretation
This is one of the cleaner situations for a breakout trader.
The volume supports the price action.
Still, risk management is necessary because breakouts can fail.
Situation 2: Breakout + Weak Volume
Price: Breaks resistance
Volume: Below recent average
Candle: Small body/weak close
Follow-through: Fails to hold
Interpretation
This is a warning.
The price technically broke the level, but participation wasn’t convincing.
Rather than predicting a failure, wait for additional confirmation.
Situation 3: Huge Volume +Very Little
Price Movement
Price: Barely moves
Volume: Extremely high
Interpretation
This is where I become particularly careful.
A lot of activity occurred, but price didn’t travel very far.
It can indicate a strong battle around that price area.
You don’t need to immediately label it accumulation or distribution.
Instead, mark the area and watch what price does next.
Volume + VWAP: A Practical Combination
If you already use VWAP, volume can add another layer of confirmation.
Consider a stock trading above VWAP.
Price pulls back toward VWAP.
During the pullback:
• Volume decreases
• Price remains above VWAP
• Selling candles become smaller
• Price starts moving upward again
• Volume increases on the bullish move
That sequence is more interesting than simply saying:
“Price is above VWAP, so I’ll buy.”
You are looking for participation to support the move away from VWAP.
The same logic can be applied in reverse for short setups.
Volume + Opening Range Breakout
Volume can also improve an ORB setup.
Suppose you mark the first 15-minute high and low.
The stock later breaks above the opening range high.
Before entering, check:
Is breakout volume stronger than the recent candles?
Then check:
Did price close above the range or merely spike above it?
Then:
Does price hold the breakout area?
This prevents one of the most common ORB mistakes—entering every small break of the opening range.
A Practical Example
Imagine you’re watching a stock trading at ₹620.
Resistance is near ₹625.
The stock has tested ₹625 twice and failed.
At 10:45 AM, price approaches ₹625 again.
You notice:
Previous candles had moderate volume.
Price consolidates below ₹625.
A bullish candle breaks ₹625.
Volume is around 2× the recent average.
Candle closes near ₹628.
The next candle doesn’t immediately fall back below ₹625.
This is a much stronger situation than simply seeing:
“Price crossed ₹625.”
Now imagine the same setup but the breakout candle has very low volume and closes at ₹624.80 after briefly touching ₹626.
The second situation doesn’t provide the same confirmation.
This is how volume should be used.
When High Volume Can Fool You
High volume is not always bullish or bearish.
A sudden news event can produce enormous activity.
A stock can rise sharply and then reverse.
A breakout can attract traders and immediately fail.
A large candle can represent both aggressive participation and a fight between buyers and sellers.
Therefore:
High volume = important
does not mean:
High volume = buy
This distinction can save you from many impulsive entries.
Why Volume Is Often Better for Filtering
Trades Than Predicting Them
This is probably the most useful lesson in this entire article.
You don’t have to use volume to predict the next candle.
Instead, use it to filter your setups.
Suppose your strategy normally produces 10 potential trades.
After checking volume, perhaps 3 setups look poorly supported.
You don’t need to predict whether those three will definitely fail.
You simply decide:
“These don’t meet my conditions.”
That is a much more realistic use of an indicator.
A Simple 5-Question Volume Test
Before clicking Buy or Sell, ask:
Question 1
What important price level am I trading around?
Question 2
Is volume increasing or decreasing?
Question 3
What is price achieving with that volume?
Question 4
Is the volume supporting my trade direction?
Question 5
If volume disappeared on the next candle, would my setup still make sense?
That last question is underrated.
If your entire trade idea depends on one giant volume bar, you may be entering too early.
Mistakes to Avoid
1. Buying Every Volume Spike
A volume spike means increased activity.
It doesn’t mean “buy.”
2. Using the Same Volume Threshold for Every Stock
Different stocks have different liquidity and trading activity.
Use relative comparisons instead.
3. Ignoring Price Location
A volume spike in the middle of a random range is not necessarily as useful as one occurring at a major support or resistance zone.
4. Looking Only at Volume Color
Green and red volume bars should not be treated as automatic buying and selling signals.
5. Chasing a Huge Candle
By the time you notice a massive volume candle, a significant part of the move may already have happened.
6. Ignoring the Market Context
A stock can have strong volume but still struggle if the broader index or sector is moving strongly against it.
7. Treating Volume as a Standalone Strategy
Volume works better when combined with price structure, support/resistance, VWAP, opening range or another clearly defined trading framework.
My Simple Intraday Volume Workflow
If I had to reduce the entire process to a practical routine, it would look like this:
Before the market opens
Mark:
• Previous day’s high
• Previous day’s low
• Important support/resistance
• Major overnight levels
• Stocks on the watchlist
• After the market opens
Don’t immediately trade just because volume is high.
Watch how price behaves.
When a setup appears
Check:
Price structure → Level → Volume → Candle close → Confirmation
Before entry
Ask:
“Is volume confirming the move, or am I simply excited because the volume bar is large?”
After entry
Don’t keep changing your trade because volume changes on every candle.
Follow your predefined stop-loss and exit rules.
A Beginner-Friendly Volume Rule
If you’re new to volume analysis, start with this:
Strong price move + strong relative volume + important level = worth investigating.
And:
Price move + weak volume + poor candle close = be cautious.
You don’t need 10 indicators.
You don’t need complicated volume formulas.
You first need to learn how price and volume behave together.
Can Volume Guarantee a Profitable Trade?
No.
Nothing in technical analysis can guarantee that an intraday trade will work.
Volume can confirm participation, reveal unusual activity and help filter weak setups, but it cannot tell you the future with certainty.
Even a breakout supported by strong volume can fail.
That’s why volume should be one part of a complete trading plan that includes:
• Entry rules
• Stop-loss
• Position sizing
• Risk per trade
• Exit rules
• Maximum daily loss
• Trading discipline
NSE also emphasizes investor education and cautions investors against relying on unsolicited tips or misleading claims.
Final Takeaway
The biggest change in my approach to volume was stopping myself from asking:
“Is volume high?”
and starting to ask:
“What is price doing with this volume?”
That one change makes volume much easier to understand.
A breakout with strong participation can deserve attention.
A breakout on weak participation can deserve caution.
A pullback on decreasing volume can be worth watching.
A pullback with aggressive opposing volume can require more confirmation.
And a huge volume spike where price barely moves can tell you that something important is happening—even if it doesn’t tell you exactly what will happen next.
So before your next intraday trade, don’t just look at the volume bar.
Look at the relationship between volume, price and the level where the trade is happening.
That is where volume becomes useful.
Quick Volume Checklist
Before entering an intraday trade, save this checklist:
• ☐ Important price level identified
• ☐ Current volume compared with recent volume
• ☐ Price movement understood
• ☐ Volume supports the trade direction
• ☐ Breakout/rejection has a proper candle close
• ☐ Trade isn’t already excessively extended
• ☐ Stop-loss is defined
• ☐ Risk per trade is predefined
• ☐ No entry based on volume alone
If several boxes remain unchecked, there is nothing wrong with skipping the trade.
Sometimes the best trade is the one you don’t take.
Important Disclaimer
This article is for educational and informational purposes only. It is not investment advice, a recommendation to buy or sell any security, or a guarantee of trading profits. Intraday trading involves substantial risk, and losses can occur quickly. Always conduct your own research, use appropriate risk management and trade according to a plan that matches your financial situation and risk tolerance.
Pingback: How to Plan a Trade Before Clicking Buy - jdtradingzone
Pingback: How to Plan an Intraday Trade Before the Market Opens - jdtradingzone