
This beginner-friendly guide explains everything in simple terms—Support and Resistance for Beginners: The Ultimate Guide—just practical knowledge you can actually use.
If you want to succeed in trading, understanding support and resistance is one of the most important skills you can develop. These levels act like invisible barriers on a price chart, helping traders predict where the market might stop, reverse, or break out.
Also check:- ( Simple Risk Management Rules for Traders ) ( How to Choose Stocks for Intraday Trading in India ) ( Best price action trading strategy for beginners ) ( Best time frame for intraday trading ) ( Real Reasons Traders Lose Money mistakes to avoid )
What is support and resistance?
What is Support and Resistance?
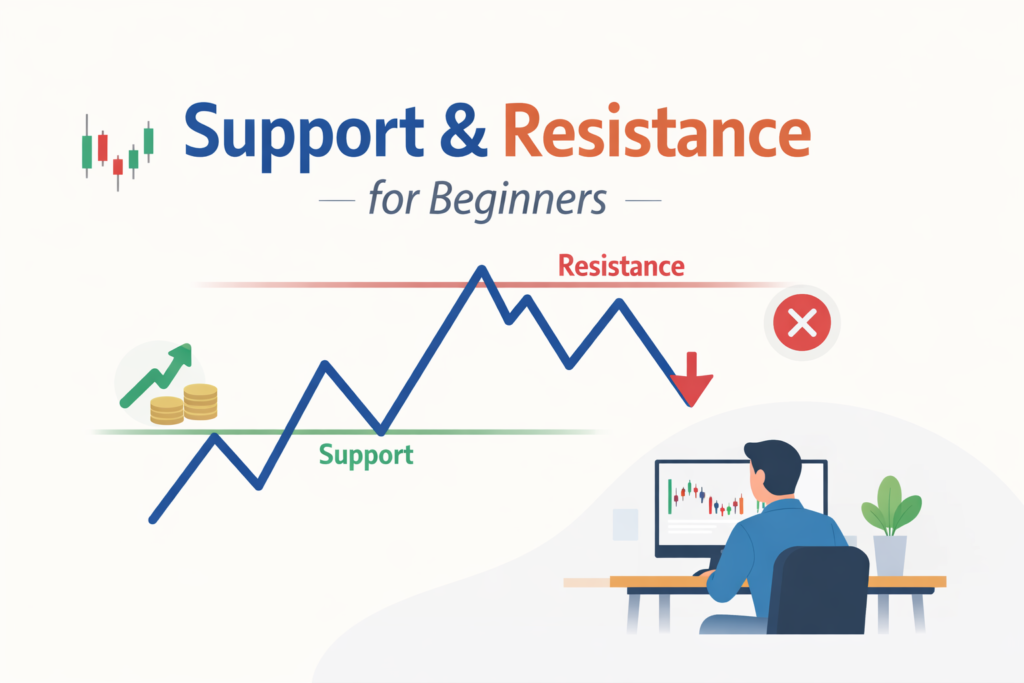
Support
Support is a price level where the market tends to stop falling and bounce back up.
👉 Think of it like a floor—price hits it and struggles to go lower.
Resistance
Resistance is a price level where the market tends to stop rising and reverse downward.
👉 Think of it like a ceiling—price hits it and struggles to go higher.
Why Support and resistance matter
Why Support and Resistance Matter
These levels are powerful because they reflect real trader behavior:
– Buyers step in at support
– Sellers step in at resistance
– Big institutions often place orders around these levels
Understanding this helps you:
– Enter trades at better prices
– Reduce risk
– Improve timing
– Avoid emotional trading
Types of Support and Resistance
1. Horizontal Support & Resistance
These are the most basic levels.
– Drawn across previous highs and lows
– Easy to identify on charts
👉 Best for beginners
2. Dynamic Support & Resistance
These levels move with price.
Examples:
– Moving Averages
– Trendlines
👉 Useful in trending markets
3. Psychological Levels
These are round numbers like:
– 100
– 500
– 1000
Traders naturally place orders here, making them strong levels.
How to Identify Support and Resistance (Step-by-Step)
Step 1: Open a Chart
Use any platform like TradingView or your broker chart.
Step 2: Look Left
Check past price action:
– Where price reversed multiple times
– Where big moves started
Step 3: Mark Zones (Not Exact Lines)
Support and resistance are areas, not exact points.
👉 Draw a zone instead of a single line
Step 4: Focus on Strong Levels
Strong levels usually have:
– Multiple touches
– Big price reactions
– High volume
How to Trade Using Support and Resistance
1. Buy at Support
– Wait for price to come near support
– Look for confirmation (like bullish candles)
– Enter a buy trade
2. Sell at Resistance
– Wait for price near resistance
– Look for rejection
– Enter a sell trade
3. Trade Breakouts
Sometimes price breaks these levels.
– Break above resistance → bullish
– Break below support → bearish
👉 Always wait for confirmation to avoid fake breakouts
Important Concepts Beginners Must Know
Support Becomes Resistance
When price breaks below support, it often becomes resistance.
Resistance Becomes Support
When price breaks above resistance, it often becomes support.
👉 This is called role reversal
Common Mistakes to Avoid
❌ Drawing Too Many Lines
Keep your chart clean. Focus only on key levels.
❌ Ignoring Market Trend
Always check the trend before trading levels.
❌ Trading Without Confirmation
Never enter blindly—wait for price action signals.
❌ Expecting Perfect Levels
Price won’t reverse exactly at your line every time.
Best Timeframes for Beginners
– Intraday traders: 5 min, 15 min
– Swing traders: 1 hour, daily
👉 Pro tip: Always mark levels on higher timeframe first
Pro Tips for Better Accuracy
– Combine with indicators like:
– VWAP
– Moving Average
– MACD
– Use volume for confirmation
– Focus on fewer, high-quality trades
– Practice on charts daily
Simple Example Strategy
Buy Setup:
1. Identify strong support
2. Wait for price to touch the zone
3. Look for bullish candle pattern
4. Enter buy
5. Stop loss below support
Sell Setup:
1. Identify resistance
2. Wait for price to reach it
3. Look for rejection
4. Enter sell
5. Stop loss above resistance
Final Thoughts
Support and resistance are the foundation of technical analysis. You don’t need complex strategies to become profitable—just mastering these levels can significantly improve your trading.
Start simple:
– Mark clean levels
– Wait patiently
– Trade with discipline
Consistency matters more than complexity.
Quick Summary
– Support = Price floor
– Resistance = Price ceiling
– Use past price to identify levels
– Trade bounces and breakouts
– Always use confirmation and stop loss
By practicing regularly and keeping your approach simple, you can turn support and resistance into a powerful tool for consistent trading success.
If this blog makes sense to you give your feedback in comments and stay tuned for more information about JD Trading Zone.
Проблема бюджетных авиабилетов стоит передо мной уже не первый год. Путешествую обычно в командировки, в связи с чем постоянно важно подобрать оптимальный тариф. Знакомые посоветовал самые дешевые авиабилеты из москвы за границу — проверил и после этого сюда захожу первым делом.
Больше всего ценю — собирает все возможные лоукостеры, включая небольшие перевозчики, чего другие агрегаторы не видит. В последний раз урезал расходы на почти 40 процентов на рейсе в Прагу — буду пользоваться дальше.
Pingback: How to read candlestick patterns easily - jdtradingzone.com
Pingback: Swing Trading Strategy for Working Professionals - jdtradingzone.com